Steam Market Research 6 archive
Report text below is preserved verbatim as Markdown. Charts, tables, methods, audit records, and analysis scripts are downloadable. Large Parquet datasets and raw review-response pages remain in the original local research directories; scripts require those inputs and the research Python environment.
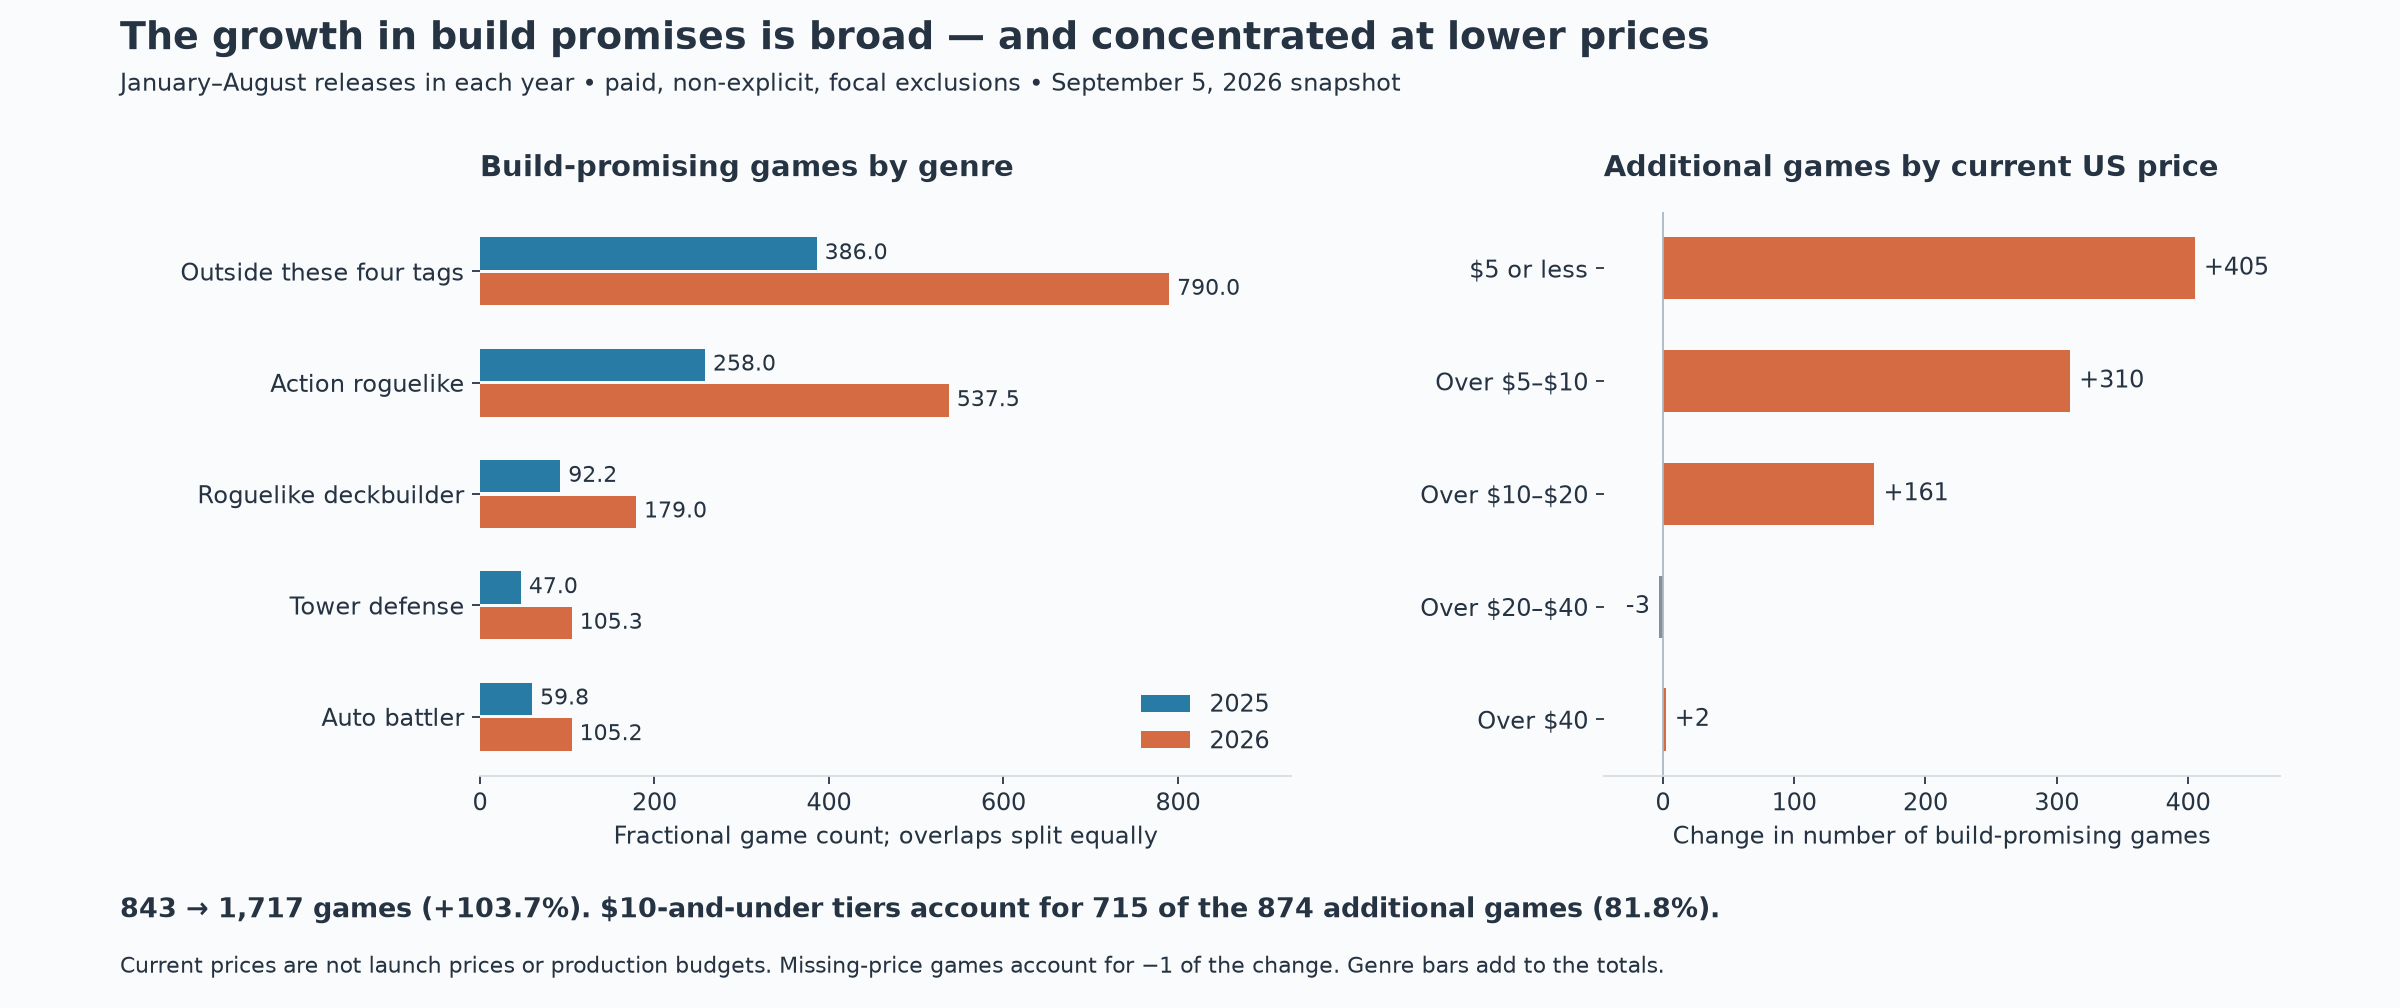
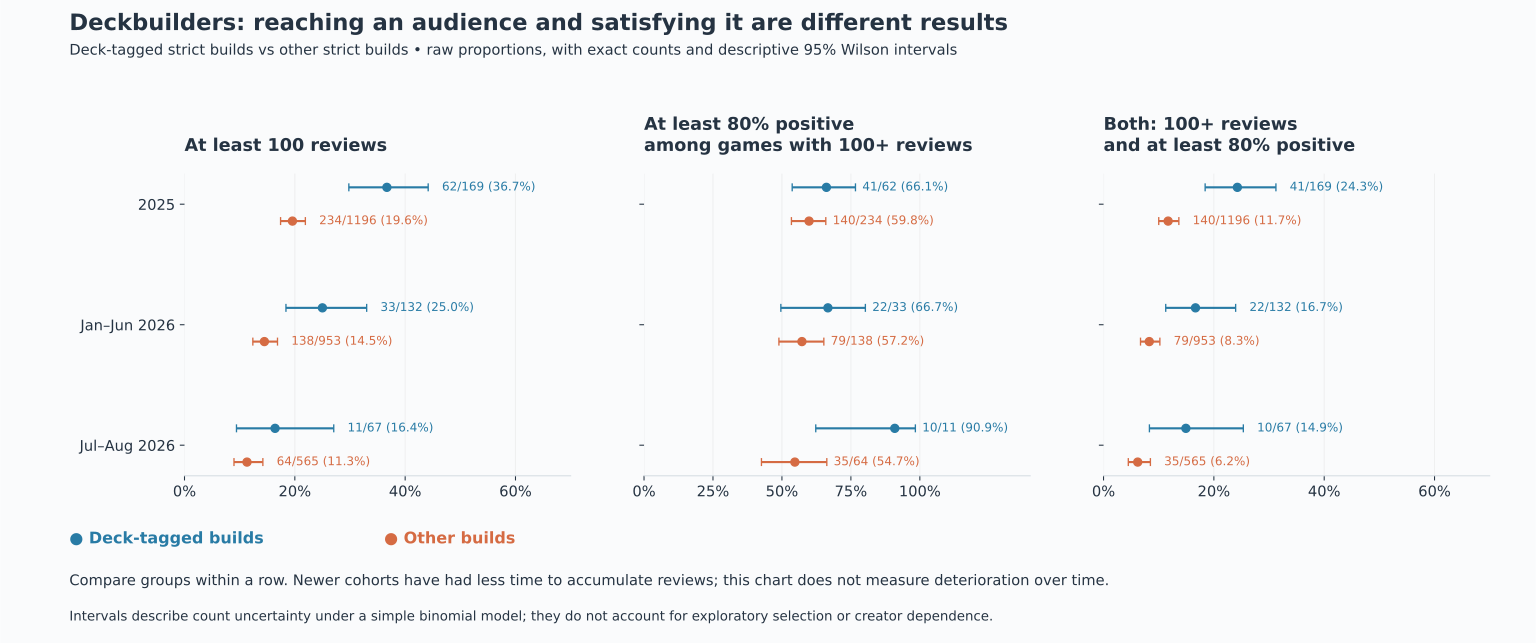
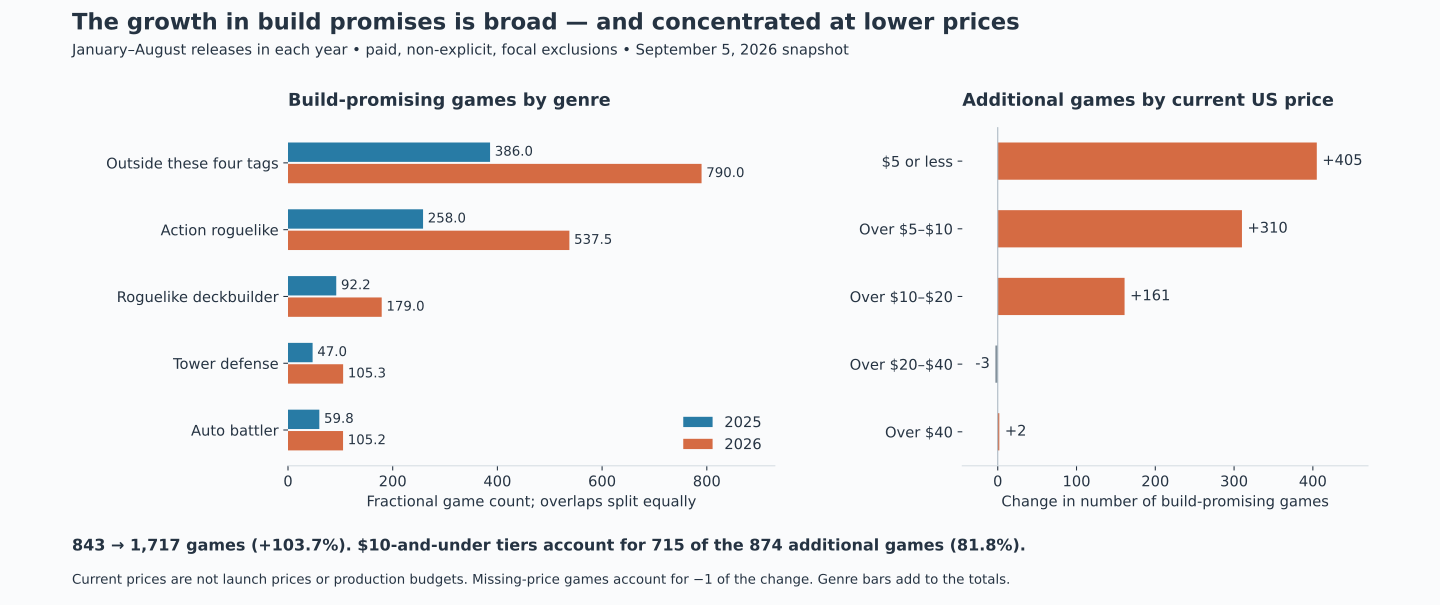
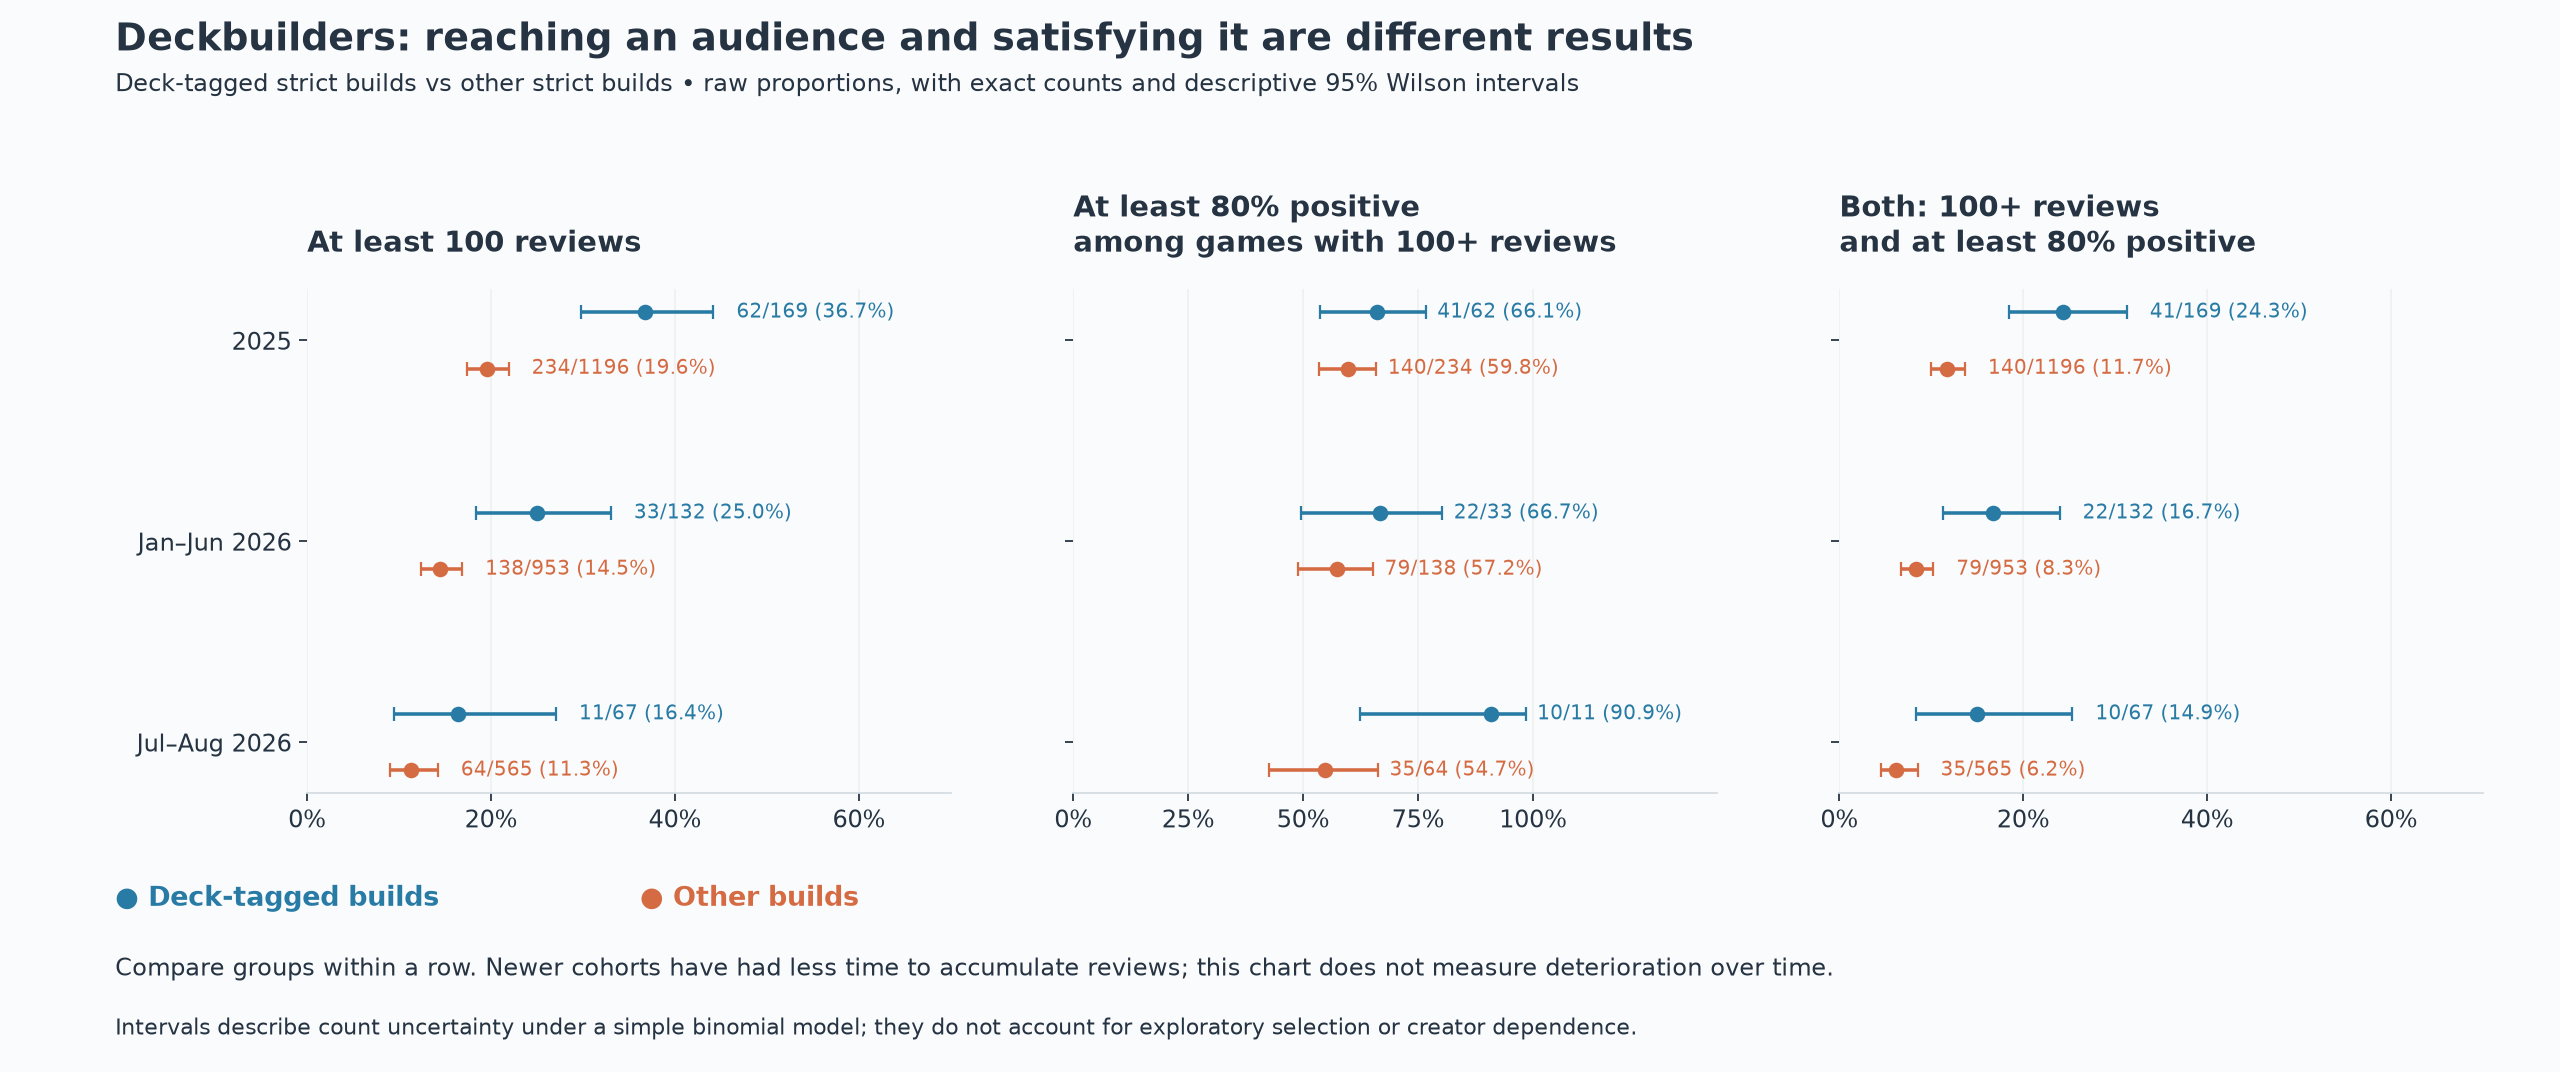
# Steam Market Research continuation — three branches All figures refer to the saved September 5, 2026 snapshot. Work was offline. The main population remains paid, released games outside the prior explicit-content and central idle/incremental/FMV exclusions. Build labels describe advertised configuration, not verified depth. Counts are Steam filtered reviews, not sales. ## 1. Growth is broad, predominantly inexpensive, and compositionally familiar January–August eligible releases rose from 9,140 in 2025 to 12,409 in 2026 (+35.8%). Strict build matches rose from 843 to 1,717 (+103.7%), increasing their share from 9.2% to 13.8%. | Top-20 tag membership | 2025 builds | 2026 builds | Growth | Builds / eligible games in tag, 2025 → 2026 | |---|---:|---:|---:|---:| | Action Roguelike | 274 | 565 | +106.2% | 38.2% → 52.9% | | Roguelike Deckbuilder | 102 | 199 | +95.1% | 79.7% → 85.8% | | Auto Battler | 73 | 136 | +86.3% | 46.5% → 50.6% | | Tower Defense | 64 | 132 | +106.2% | 20.4% → 30.1% | | None of those four tags | 386 | 790 | +104.7% | 4.9% → 7.5% | Rows overlap. Splitting each overlapping game equally among its memberships allocates the 874 additional build matches as follows: action roguelike 32.0%, roguelike deckbuilder 9.9%, auto battler 5.2%, tower defense 6.7%, and outside all four 46.2%. These are bookkeeping contributions, not causal attributions. The remainder is not an unexplored genre. Its overlapping top-10 tags include Card Game (94 → 226), Deckbuilding (68 → 176), Turn-Based Tactics (76 → 177), RPG (168 → 296), and Dungeon Crawler (47 → 100). Some card games simply do not carry the narrower Roguelike Deckbuilder tag. Thus the 9.9% allocation must not be interpreted as the contribution of all card-based games. An exact symmetric decomposition across mutually exclusive genre signatures assigns 458.0 of the additional matches (52.4%) to larger/changing catalog groups at their average build-match rates, and 416.0 (47.6%) to higher build-match rates inside those groups at their average sizes. This does not identify changing gameplay versus changing store language, but growth is not only a consequence of more games being released. | Advertised object, overlapping labels | 2025 count/share | 2026 count/share | |---|---:|---:| | Equipment/skills | 448 / 53.1% | 892 / 52.0% | | Cards/decks | 209 / 24.8% | 454 / 26.4% | | Party composition | 120 / 14.2% | 231 / 13.5% | | Machine assembly | 23 / 2.7% | 41 / 2.4% | The number of build promises roughly doubles while these broad object shares remain fairly stable. This is consistent with expansion across familiar forms of configuration; it does not demonstrate that individual games or their rules have become less inventive. Machine and spatial text screens remain incomplete. | Current US price | 2025 builds | 2026 builds | Change | |---|---:|---:|---:| | $5 or less | 264 | 669 | +405 | | Over $5–$10 | 282 | 592 | +310 | | Over $10–$20 | 224 | 385 | +161 | | Over $20–$40 | 44 | 41 | −3 | | Over $40 | 10 | 12 | +2 | | Missing | 19 | 18 | −1 | The $10-and-under tiers supply 715/874 of the increase (81.8%). Their share of build matches rises from 64.8% to 73.4%; the median current price falls from $8.99 to $6.99. These are current prices, not launch prices or production budgets. Within the <=$5 eligible pool, build matches rise from 264/4,596 (5.7%) to 669/5,921 (11.3%). This is more than simply adding cheap games at the old rate. The growth is not dominated by a few prolific reported creators. Developer groups rise from 831 to 1,677; the top ten account for 21/843 (2.5%) and 26/1,717 (1.5%) build games respectively. Publisher top-ten shares are 4.3% and 2.2%. These reported identities are not verified corporate ownership. Longer descriptions explain part of the increased opportunity for text matching. Holding the 2025 description-length distribution fixed lowers the 2026 build share from 13.8% to 12.9%, still above 9.2%. This checks word-count composition, not every possible change in writing style or classifier error.  ## 2. Deckbuilder reception remains favorable, but its components differ Compare families inside each period, not period rates against one another. | Period/group | Games | 100+ reviews | >=80% positive among 100+ | Joint benchmark | |---|---:|---:|---:|---:| | 2025 deck-tagged builds | 169 | 62 / 36.7% | 41/62 / 66.1% | 41/169 / 24.3% | | 2025 other builds | 1,196 | 234 / 19.6% | 140/234 / 59.8% | 140/1,196 / 11.7% | | H1 2026 deck-tagged builds | 132 | 33 / 25.0% | 22/33 / 66.7% | 22/132 / 16.7% | | H1 2026 other builds | 953 | 138 / 14.5% | 79/138 / 57.2% | 79/953 / 8.3% | | Jul–Aug 2026 deck-tagged builds | 67 | 11 / 16.4% | 10/11 / 90.9% | 10/67 / 14.9% | | Jul–Aug 2026 other builds | 565 | 64 / 11.3% | 35/64 / 54.7% | 35/565 / 6.2% | Date/current-price standardized ratios, relative to the full build pool, are: | Outcome | 2025 | H1 2026 | Jul–Aug 2026 | |---|---:|---:|---:| | At least 100 reviews | 1.38 | 1.19 | 0.97 | | Joint: 100+ reviews and >=80% positive | 1.50 | 1.39 | 1.49 | | >=80% positive within the 100+ subset | 1.08 | 1.14 | 1.63 | The newest group's joint advantage comes from positive reception among the relatively few reviewed games, not excess volume after standardization. Ten of eleven is encouraging but imprecise: a simple 95% Wilson interval is about 62%–98%. These intervals do not resolve exploratory selection or measurement limitations. The low-review tail also differs. Below ten reviews are 22.5% of 2025 deck builds versus 47.9% of others; 42.4% versus 58.4% in H1; and 47.8% versus 68.3% in July–August. Median reviews are 40 versus 11, 15 versus 5, and 10 versus 2. At the opposite end, 1,000-review rates are 8.3% versus 7.1% in 2025, 6.1% versus 4.4% in H1, and 0/67 versus 19/565 (3.4%) in July–August. The favorable joint benchmark is not a universal advantage at every response scale.  The wording filter does not explain away the association. Across all eligible paid deck-tagged games, including those missed by the strict classifier, joint rates are 48/203 (23.6%), 26/151 (17.2%), and 11/81 (13.6%). Among the missed games alone they are 7/34, 4/19, and 1/14. The newest missed group is mostly low-review, but including it does not remove the broad favorable pattern. The tag is nevertheless semantically loose. Of 368 strict deck-tagged games, 73 lack the prior classifier's explicit deck-building language signal. Examples include kingdom builders, jewel parties, auto battlers and dice games; some are also ordinary textual false negatives. Restricting to the 295 with that signal leaves joint results of 34/135 (25.2%), 20/111 (18.0%), and 9/49 (18.4%). Their date/price ratios are 1.50, 1.49 and 1.78. The core association is not being manufactured by the non-card examples. The raw deck joint rate exceeds the other-build rate in all 27 combinations of three periods, three review thresholds (50/100/200), and three positivity thresholds (75/80/85). These are correlated sensitivity checks, not 27 independent replications. Removing the largest-review publisher leaves standardized joint ratios of 1.43, 1.40 and 1.36. Adding description-length strata leaves ratios 1.50, 1.40 and 1.39. None establishes a causal genre advantage. ### Hybrid subgroups Joint benchmark counts by overlapping top-20 hybrid tags: | Hybrid signal within deck-tagged strict builds | 2025 | H1 2026 | Jul–Aug 2026 | Combined | |---|---:|---:|---:|---:| | Party/tactics | 16/58 | 8/46 | 5/27 | 29/131 (22.1%) | | Economy/building | 4/15 | 4/14 | 2/6 | 10/35 (28.6%) | | Inventory Management | 6/13 | 3/10 | 1/4 | 10/27 (37.0%) | | Auto Battler | 10/17 | 1/18 | 2/7 | 13/42 (31.0%) | | Tower Defense | 1/6 | 1/4 | 0/2 | 2/12 (16.7%) | | Action Roguelike | 2/12 | 1/6 | 1/5 | 4/23 (17.4%) | | None of these hybrid tags | 15/75 | 8/57 | 2/28 | 25/160 (15.6%) | Pooled rates conceal instability. Auto Battler's 31.0% comes largely from 2025's 10/17 (58.8%); H1 is only 1/18 (5.6%). Unequal ages forbid a deterioration claim, but the row cannot be presented as steady replication. Party/tactics is close to the deck reference after date/price comparison: 1.10 times expected using top-20 tags, 1.03 using top-ten. Combining all selected hybrid signals gives only 1.14 times the deck expectation at top-20, 1.05 at top-ten. Adding another genre is not a demonstrated general recipe. Inventory Management is the strongest repeatable descriptive hybrid signal here: 1.75 times the within-deck expectation at top-20, and 2.18 at top-ten, but on only 27 and 18 games. Its meaning is heterogeneous. The audit found seven that explicitly pitch packing, layout, formations or wiring: Inventorix, Toy Smash Kaboom!, SealChain, Moonsigil Atlas, Turnbound, Wireworks and Papercraft Tactics. The remaining twenty include custom-card components, equipment sets, party slots, magazine bullets and other systems. Those seven have six games with 100+ reviews and four meeting the joint benchmark. This is a selected tiny subset, not a market-wide spatial-game premium. Their individual results show the spread: | Game | Store-described configuration | Reviews | Positive | |---|---|---:|---:| | Inventorix | Pack items and aliens to generate income | 131 | 100% | | Toy Smash Kaboom! | Arrange and combine a tabletop toy army | 551 | 84% | | SealChain: Call of Blood | Item links and formations produce effects | 533 | 56% | | Moonsigil Atlas | Physical card space replaces an energy budget | 259 | 82% | | Turnbound | Neighboring inventory tiles affect one another | 441 | 78% | | Wireworks | Wire signals through a defensive module board | 602 | 89% | | Papercraft Tactics | Rotate and connect item inputs and outputs | 4 | 100% | ## 3. Concrete rules are recoverable; their market advantage is not established The frozen 60-description pilot yielded 29 concrete-rule cases, 25 generic configuration promises and six unclear cases. Twelve games were sampled in each exclusive family, four per period. Numerical dataset outcomes and prices were hidden during labeling; names and store-embedded quotes were visible. These are single-reader judgments and an intentionally balanced sample, not prevalence or classifier-accuracy estimates. | Description label | Games | 100+ reviews | Joint benchmark | Median reviews | Median description words | |---|---:|---:|---:|---:|---:| | Concrete rule | 29 | 7 (24.1%) | 7 (24.1%) | 5 | 379 | | Generic promise | 25 | 4 (16.0%) | 2 (8.0%) | 5 | 231 | | Unclear | 6 | 1 (16.7%) | 1 (16.7%) | 14 | 334 | The tempting reading of the 24.1% versus 8.0% joint rates is too strong. Both clear/generic medians are five reviews. Sixteen of 29 concrete cases have fewer than ten reviews. Longer descriptions have more room to state a rule. The concrete set also contains Final Fantasy Tactics and GRIME II, whereas the genre composition, price and prior reputation are not matched. A narrower label, also frozen before outcomes, requires an explicit dependency between configurable parts or between a selected part and a stated trigger/context. It yields 3/18 (16.7%) meeting the joint benchmark, versus 7/42 (16.7%) without that label. Median reviews are four and 6.5 respectively. This sample does not support a market advantage for explicit conditional interactions, nor is it large or controlled enough to establish their irrelevance. Rather than scaling an unreliable universal regex, preserve the rule examples: | Game | Concrete advertised rule | Reviews / positive | Price | |---|---|---:|---:| | D.P.S: Weapons Testing Facility 2 | Modifiers affect projectiles to their right; bounce can grow projectiles | 3 / 100% | $9.99 | | Fantasy Monster Hunt | Magic waves hitting electromagnetic fields produce smaller wave rings after an unlock | 43 / 79% | $5.99 | | Dice Gun Commando | Chosen dice results trigger weapon modifiers, such as healing on a pair of ones | 20 / 100% | $4.99 | | The Royal Writ | Cards that reach the enemy base before victory are permanently lost from the run deck | 419 / 80% | $14.99 | | King's Well | Cards spent in machines cannot contribute to unused poker-hand bonuses | 17 / 76% | $14.99 | | Flowers and Deities | Deaths fund spells and summons; friendly units can be sacrificed for blood | 239 / 89% | $12.99 | | Replicat | Effects keep tiles revealed or let mismatched memory pairs match | 213 / 99% | $9.99 | | Card Coder | Construct cards from triggers, conditions, selectors and effects | 27 / 74% | $14.99 | | Faith in Despair | Build card abilities from triggers, actions and modifiers; playing them advances despair | 74 / 95% | $11.99 | Very small review totals make even 100% positivity weak evidence. These mechanics are store claims, not verified behavior or evidence of an economical production schedule. The gallery deliberately retains weak and intermediate responses. ## Interpretation The most useful continuation is more specific than collecting extra item counts. First, investigate games where the rules for assembling a build themselves become playable material: ordered modifiers, wires, card shapes or component grammars. Moonsigil Atlas makes the card's footprint part of its cost; Card Coder makes the card's behavior something the player constructs. These are concrete design differences, even though their reception varies substantially. Second, investigate resources with competing uses. King's Well forces a choice between spending a card and retaining its poker-hand value. Flowers and Deities turns a unit into both a combatant and potential fuel. The Royal Writ makes advancing a card potentially cost the future deck. These rules explain why an option can change value without requiring a huge nominal item catalog. They also broaden conditional value beyond positive combo multiplication to sacrifice, opportunity cost and preservation. Third, keep uncertainty about reception separate from the usefulness of a design example. A three-review game can explain an excellent configuration rule; it cannot establish unmet demand for that rule. A generic description can conceal an excellent game. The stronger quantitative result remains the deckbuilder family's reception pattern, while its hybrid subgroups and individual mechanisms require more specific evidence. All 45 accounting and consistency checks passed. Both figures were visually inspected. Full definitions, individual cases, tables, scripts, source hashes and limitations are retained alongside this report; no network collection was resumed.