Steam Market Research 7 archive
Frozen research artifacts, September 7, 2026. Large Parquet datasets, raw API pages and the full announcement inventory remain in the local research directory.
# Surviving review arrivals over game lifetimes

New bounded study authorized by the owner when requesting the remaining research
avenues. The earlier language study's stopped collector remains stopped. This
study has a separate frozen sample and policy; the root bulk catalog policy is
unchanged and remains paused.

## Frame and sample

65,839 currently paid games outside explicit descriptors 3/4, with recorded
release dates in 2016–2024 and fewer than 10,000 snapshot filtered reviews.
The 964 games at or above 10,000 reviews are explicitly outside this frame;
the study does not estimate the trajectory distribution of Steam's biggest
games. This frame covers 98.6% of the otherwise eligible app identities, not
98.6% of reviews or purchases.

Five games were randomly selected per period x current-review band: periods
2016–2018, 2019–2021, 2022–2024; bands 0–49, 50–199, 200–999, 1,000–9,999. Sixty
games total, with fixed seeds and no name/tag/trajectory selection. Current
review bands define the sampling design, not launch-time success categories.
Collection order interleaves strata in complete twelve-game rounds. Sample
probabilities and original source counts remain saved.

## Collection and history meaning

All-language Steam-purchase reviews with off-topic filtering, ordered by creation
time using filter=recent, paginated to an empty response. Only review IDs,
creation/update timestamps, purchase flag and Early Access flag are retained.
No text, account/profile identifiers, playtime or recommendation sentiment is
collected. Sanitized response pages preserve cursors, summaries and timestamps.

These are creation dates of currently returned reviews. Deleted, hidden or
filtered reviews can be absent. Summary counts can differ slightly from the
paginated rows. Gaps and late arrivals describe surviving reviews, not the
original complete transaction or review record. Nothing identifies new versus
returning players, purchases, revenue, marketing effort or update effects.

Caps: 800 requests and 65,000 retained reviews, 2 MB per response, at least two
seconds between request starts, no retries, stop on errors. The policy is closed
in a finally block. A STOP file prevents another request. Original snapshot
responses and prior studies are not modified.

## Time definitions

- Review counts by 7/30/90/365/730 actual days from the recorded earliest Steam
  date, not the first nonempty month. Horizons ending after September 1, 2026
  remain missing. Very small pre-date offsets up to seven days enter the early
  window; a review more than seven days before the date flags the release clock
  and removes that game from release-anchored comparisons.
- A separate first-surviving-review clock is retained for sensitivity. It is
  neither proof of first public availability nor a replacement release date.
- Full calendar-month series include zero months. Recent activity means the
  twelve full months September 2025 through August 2026. One active month can
  contain just one review; counts and months with at least five reviews are also
  retained so isolated reviews are not called a large audience.
- Late-burst screen: a three-month block starting after year one, with at least
  twenty reviews and at least four times the monthly rate in the preceding six
  months (a one-review expected-block floor prevents division by zero).
  Overlapping starts within six months are grouped. Alternative screens use
  15/3x and 50/6x. This is an exploratory temporal shape, not proof of a revival,
  statistical significance, or a particular cause.
- Ever-burst rates have unequal observation lengths. A separate first-two-year
  indicator requires a fully mature two-year window. Do not interpret raw
  cross-era ever-burst differences as a temporal trend.

Weighted proportions and quantiles use frame/sample weights. Approximate 95%
intervals use stratified linearized ratio variance with finite population
correction, and reflect only sampling variation. Boundary samples without
variation receive no interval. Small samples within each cell mean estimates
are approximate; precise genre rankings are not supported. Counts by current
review band are descriptive and cannot be read as forecasts for new releases.

Headline distributions separate games with at least fifty current reviews from
the quietest group. First-year fractions and growth ratios exclude zero
denominators; an additional first-year >=10-review sensitivity is retained.
Current lifetime fractions remain age-dependent even when their first-year
numerators use exact days. Equal-age first-year and second-year measures are
therefore reported separately.

## Reproduction

Use `../.venv/bin/python`: `prepare.py` freezes the sample; `collect.py` is the
scoped network step and requires an active policy; `analyze.py`, `followups.py`,
`charts.py`, and `validate.py` are offline. Reproducing saved results does not
require restarting collection. Source documentation:
https://partner.steamgames.com/doc/store/getreviews .
# Review activity over game lifetimes

The launch window is important, but it is not the entire first year, and a
continuing review stream is much more common than a dramatic late burst among
games that accumulated at least fifty reviews. Continuing activity can also be
very small. The evidence distinguishes those things rather than putting every
game into an alive/dead category.

## Collection and scope

Collected complete currently returned Steam-purchase review streams for sixty
randomly selected games, all languages, off-topic filtering enabled: **51,127
reviews in 604 requests**, with no request errors or retries. All sixty streams
were paginated to an empty response. Forty-eight match their initial API totals
exactly; the largest difference in the other twelve is four reviews. No records
were invented to fill those differences.

The frame is 65,839 paid games outside explicit descriptors 3/4, released in
2016–2024, with fewer than 10,000 current snapshot reviews. It covers 98.6% of
otherwise eligible app identities; the 964 games with 10,000+ reviews are outside
the study. This is not a study of the biggest Steam hits or an estimate of their
share of attention. Five games were selected per era/current-review stratum.

Reviews are currently surviving records, not a complete archive of everything
ever written. A review arrival is not necessarily a new purchase or new player;
an existing player can review much later. Text, sentiment, account identifiers,
playtime and news/update histories were not collected. These data measure
temporal activity, not its cause.

## Exact launch windows and dates

Counts use actual days after the recorded earliest Steam date, with complete
calendar months through August 2026. Monthly gaps remain zeros rather than
being removed. First 730-day outcomes remain missing where immature.

Two source dates are clearly later than the earliest returned reviews:
Cloudbase Prime by about 300 days, Curious Expedition by about 472 days. Early
records include Steam's written-during-Early-Access flag. Their recorded dates
are excluded from launch-anchored results; first-review-clock sensitivities
remain separate and do not pretend to establish exact first availability.

## After the first ninety days

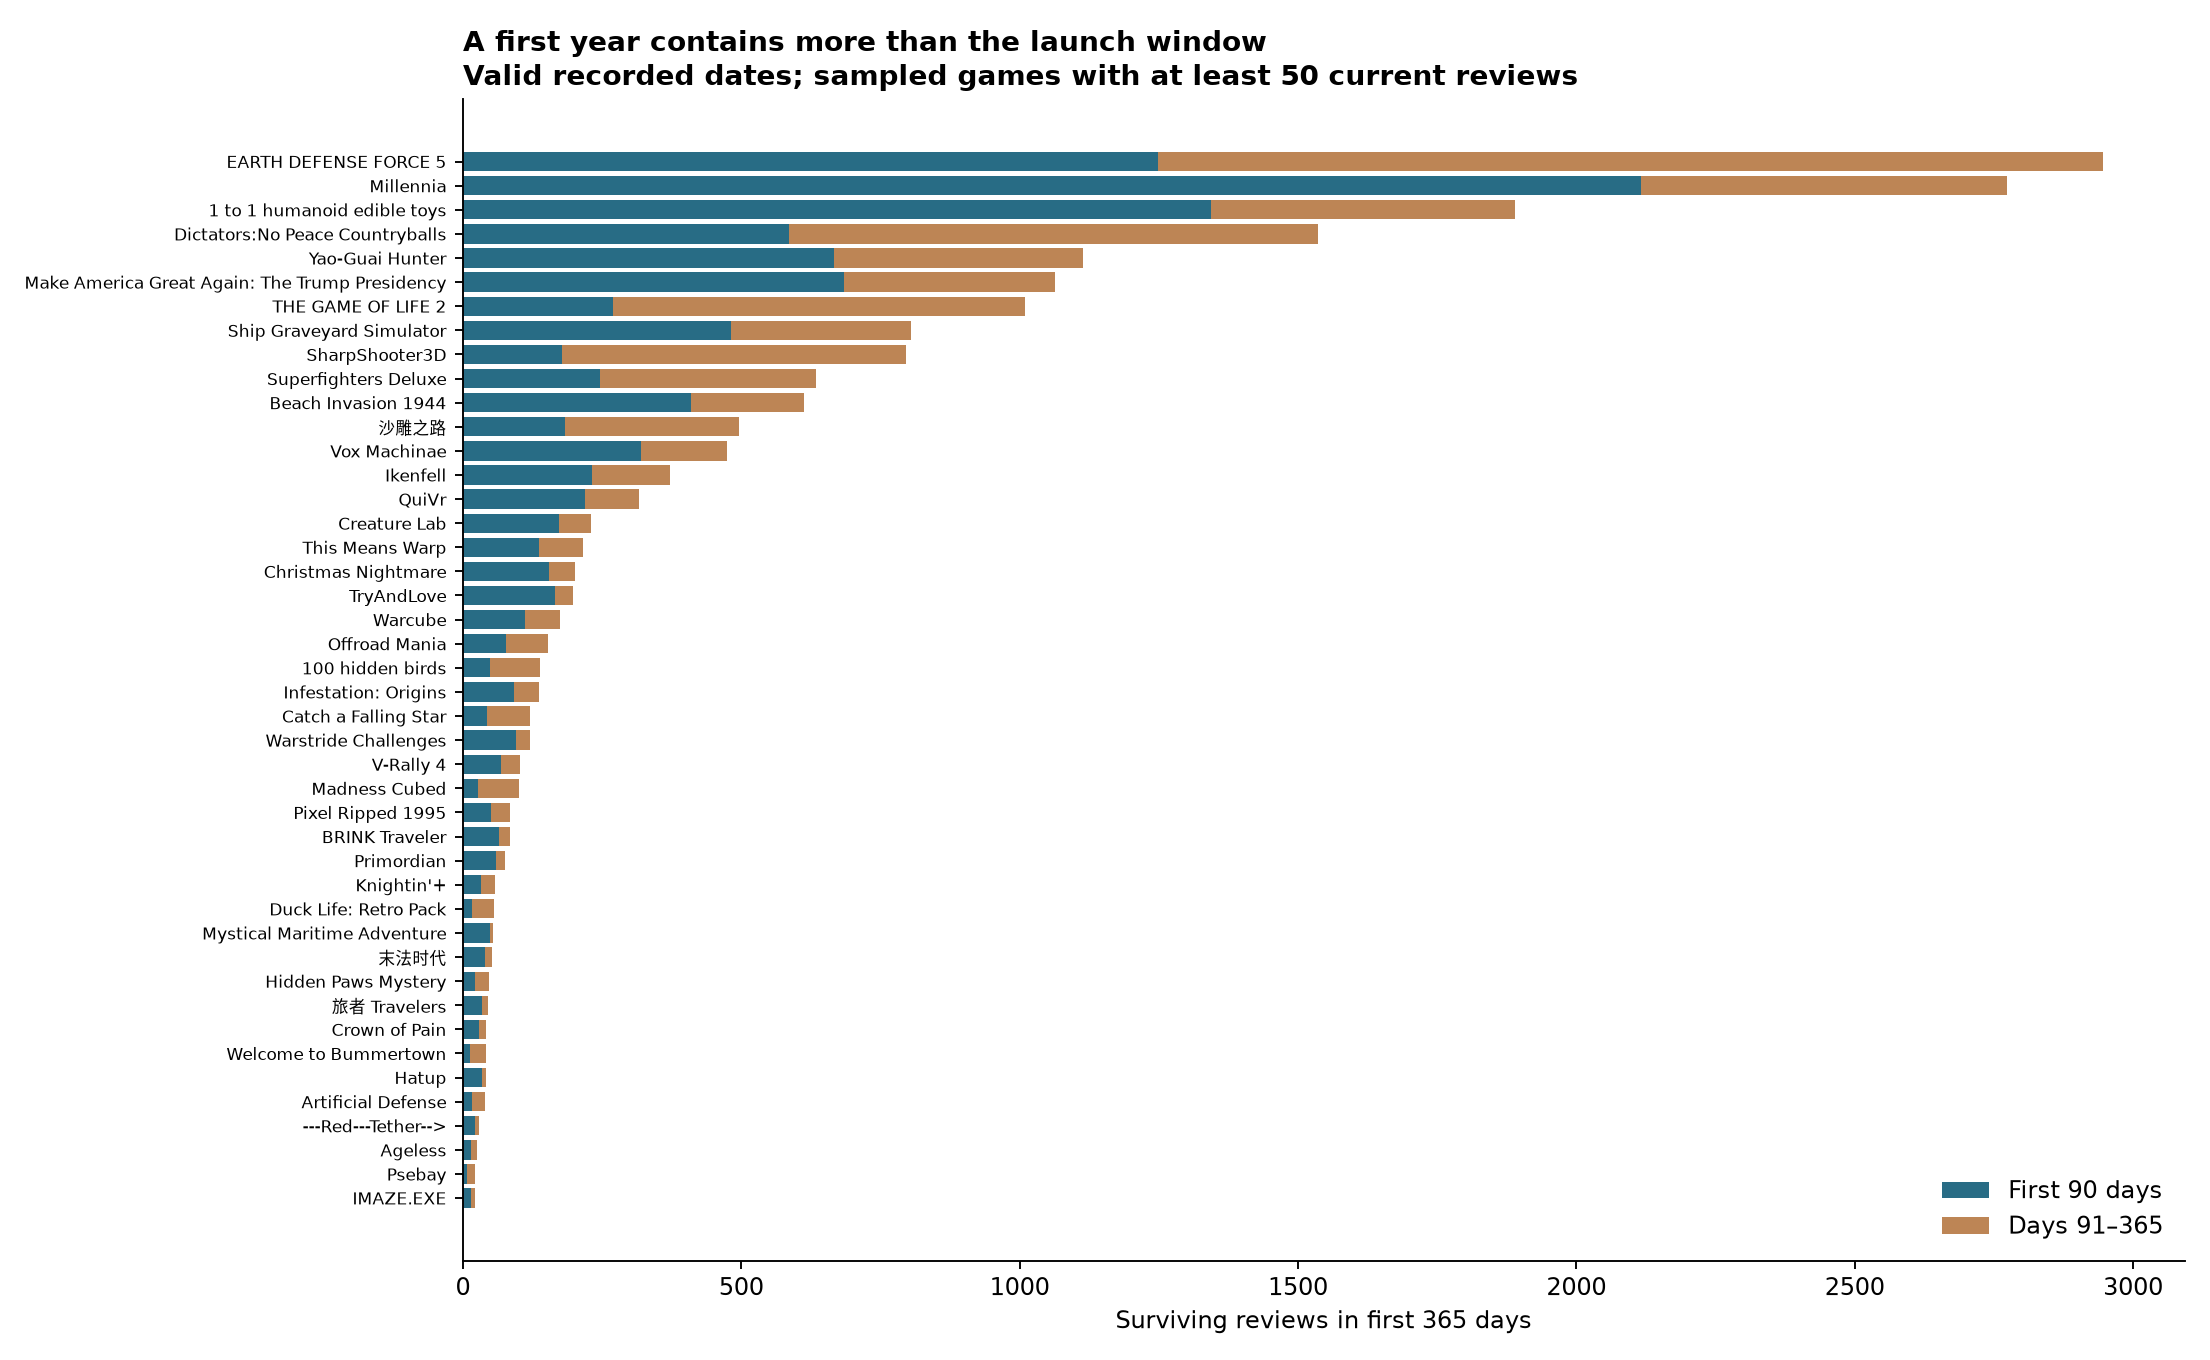
Among games with at least fifty current reviews and a valid recorded date
(44 sampled games), the weighted median first-year total is **1.50 times** the
first-ninety-day total. Equivalently, about **one third of the first year's
surviving reviews arrive during days 91–365**. The unweighted median ratio is
1.57; requiring at least ten reviews in year one does not change the population
here. The first-surviving-review clock gives 1.50 too. Restricting to exact
API-summary matches gives about 1.45, so small reconciliation differences do not
drive the finding.

This is continued accumulation, not proof that a particular game can compensate
for an arbitrarily quiet launch. Sampling conditions on the current size of its
review record, and the outcomes do not identify marketing or quality effects.

The result varies across current response scales. Unweighted medians of the
first-year share arriving after day 90 are 28.6% in the 50–199 band, 36.7% in
200–999, and 48.9% in 1,000–9,999. There are fifteen sampled games per band,
with one invalid date in the largest band. These are descriptive current-band
comparisons, not launch-time forecasts.

Cheap versus more expensive games do not separate strongly in this bounded
sample. At current prices up to $5, the weighted first-year/day-90 ratio is
1.50 (14 valid cases); above $5 it is 1.49 (27). The sample cannot support a
precise price effect, but it does not reproduce a clear general cheap-game tail
advantage at this horizon.

## Beyond the first year

For the 42 valid-date, 50-plus-review games with mature second-year windows,
the weighted median second-year count is **41% of the first-year count**. Most
decline: only three of those 42 have more reviews in year two than year one.
A decline in rate can still add a substantial number of reviews over time.

Of the 44 valid-date games with at least fifty current reviews:

- 43 add at least ten surviving reviews after year one.
- 33 add at least fifty.
- 29 add at least one hundred.
- 14 add at least five hundred.

These are sample counts, not population percentages. At the current snapshot,
the weighted median first-year share of the accumulated record is 50%, but
observation time strongly affects it: 44% for 2016–2018, 42% for 2019–2021 and
68% for 2022–2024. It must not be presented as a universal forecast that half
of eventual response will come after the first year.

## Recent activity versus a token trickle

The recent window is September 2025 through August 2026. For the population
with fifty to 9,999 current reviews, the stratified estimates are:

| Measurement | Estimated game share | Approximate 95% sampling interval |
|---|---:|---:|
| At least one review in the last twelve full months | 88.1% | 79.0–97.2% |
| At least twelve reviews in that year | 55.2% | 41.0–69.4% |
| Reviews in at least nine of the twelve months | 49.6% | 36.2–63.0% |
| Reviews in all twelve months | 24.8% | 16.4–33.3% |

These intervals reflect only sampling uncertainty, with five games per original
stratum. They do not cover delisting, deleted reviews, source-date errors or
conditioning on present response. Current review-band differences are large:

| Current review band | Games sampled | Any recent review | At least twelve recent reviews | Median recent count |
|---|---:|---:|---:|---:|
| 0–49 | 15 | 8 | 0 | 1 |
| 50–199 | 15 | 11 | 4 | 4 |
| 200–999 | 15 | 15 | 11 | 22 |
| 1,000–9,999 | 15 | 15 | 15 | 237 |

All fifteen of the largest sampled band have activity in at least nine recent
months, and thirteen have activity in all twelve. This does not prove the
population rate is exactly 100%. Conversely, the full-frame weighted median
recent count is only two because the frame contains so many very quiet games.
Counting a single late review as a revival would obscure this distinction.

## Named trajectories

| Game | First 30 days | First 90 days | First 365 days | Sep 2025–Aug 2026 | Active months in that recent year |
|---|---:|---:|---:|---:|---:|
| Madness Cubed | 10 | 27 | 101 | 83 | 12 |
| Superfighters Deluxe | 180 | 246 | 634 | 280 | 12 |
| V-Rally 4 | 62 | 69 | 103 | 185 | 12 |
| Yao-Guai Hunter | 437 | 667 | 1,114 | 237 | 12 |
| Warstride Challenges | 81 | 95 | 120 | 14 | 8 |
| This Means Warp | 102 | 136 | 215 | 22 | 9 |

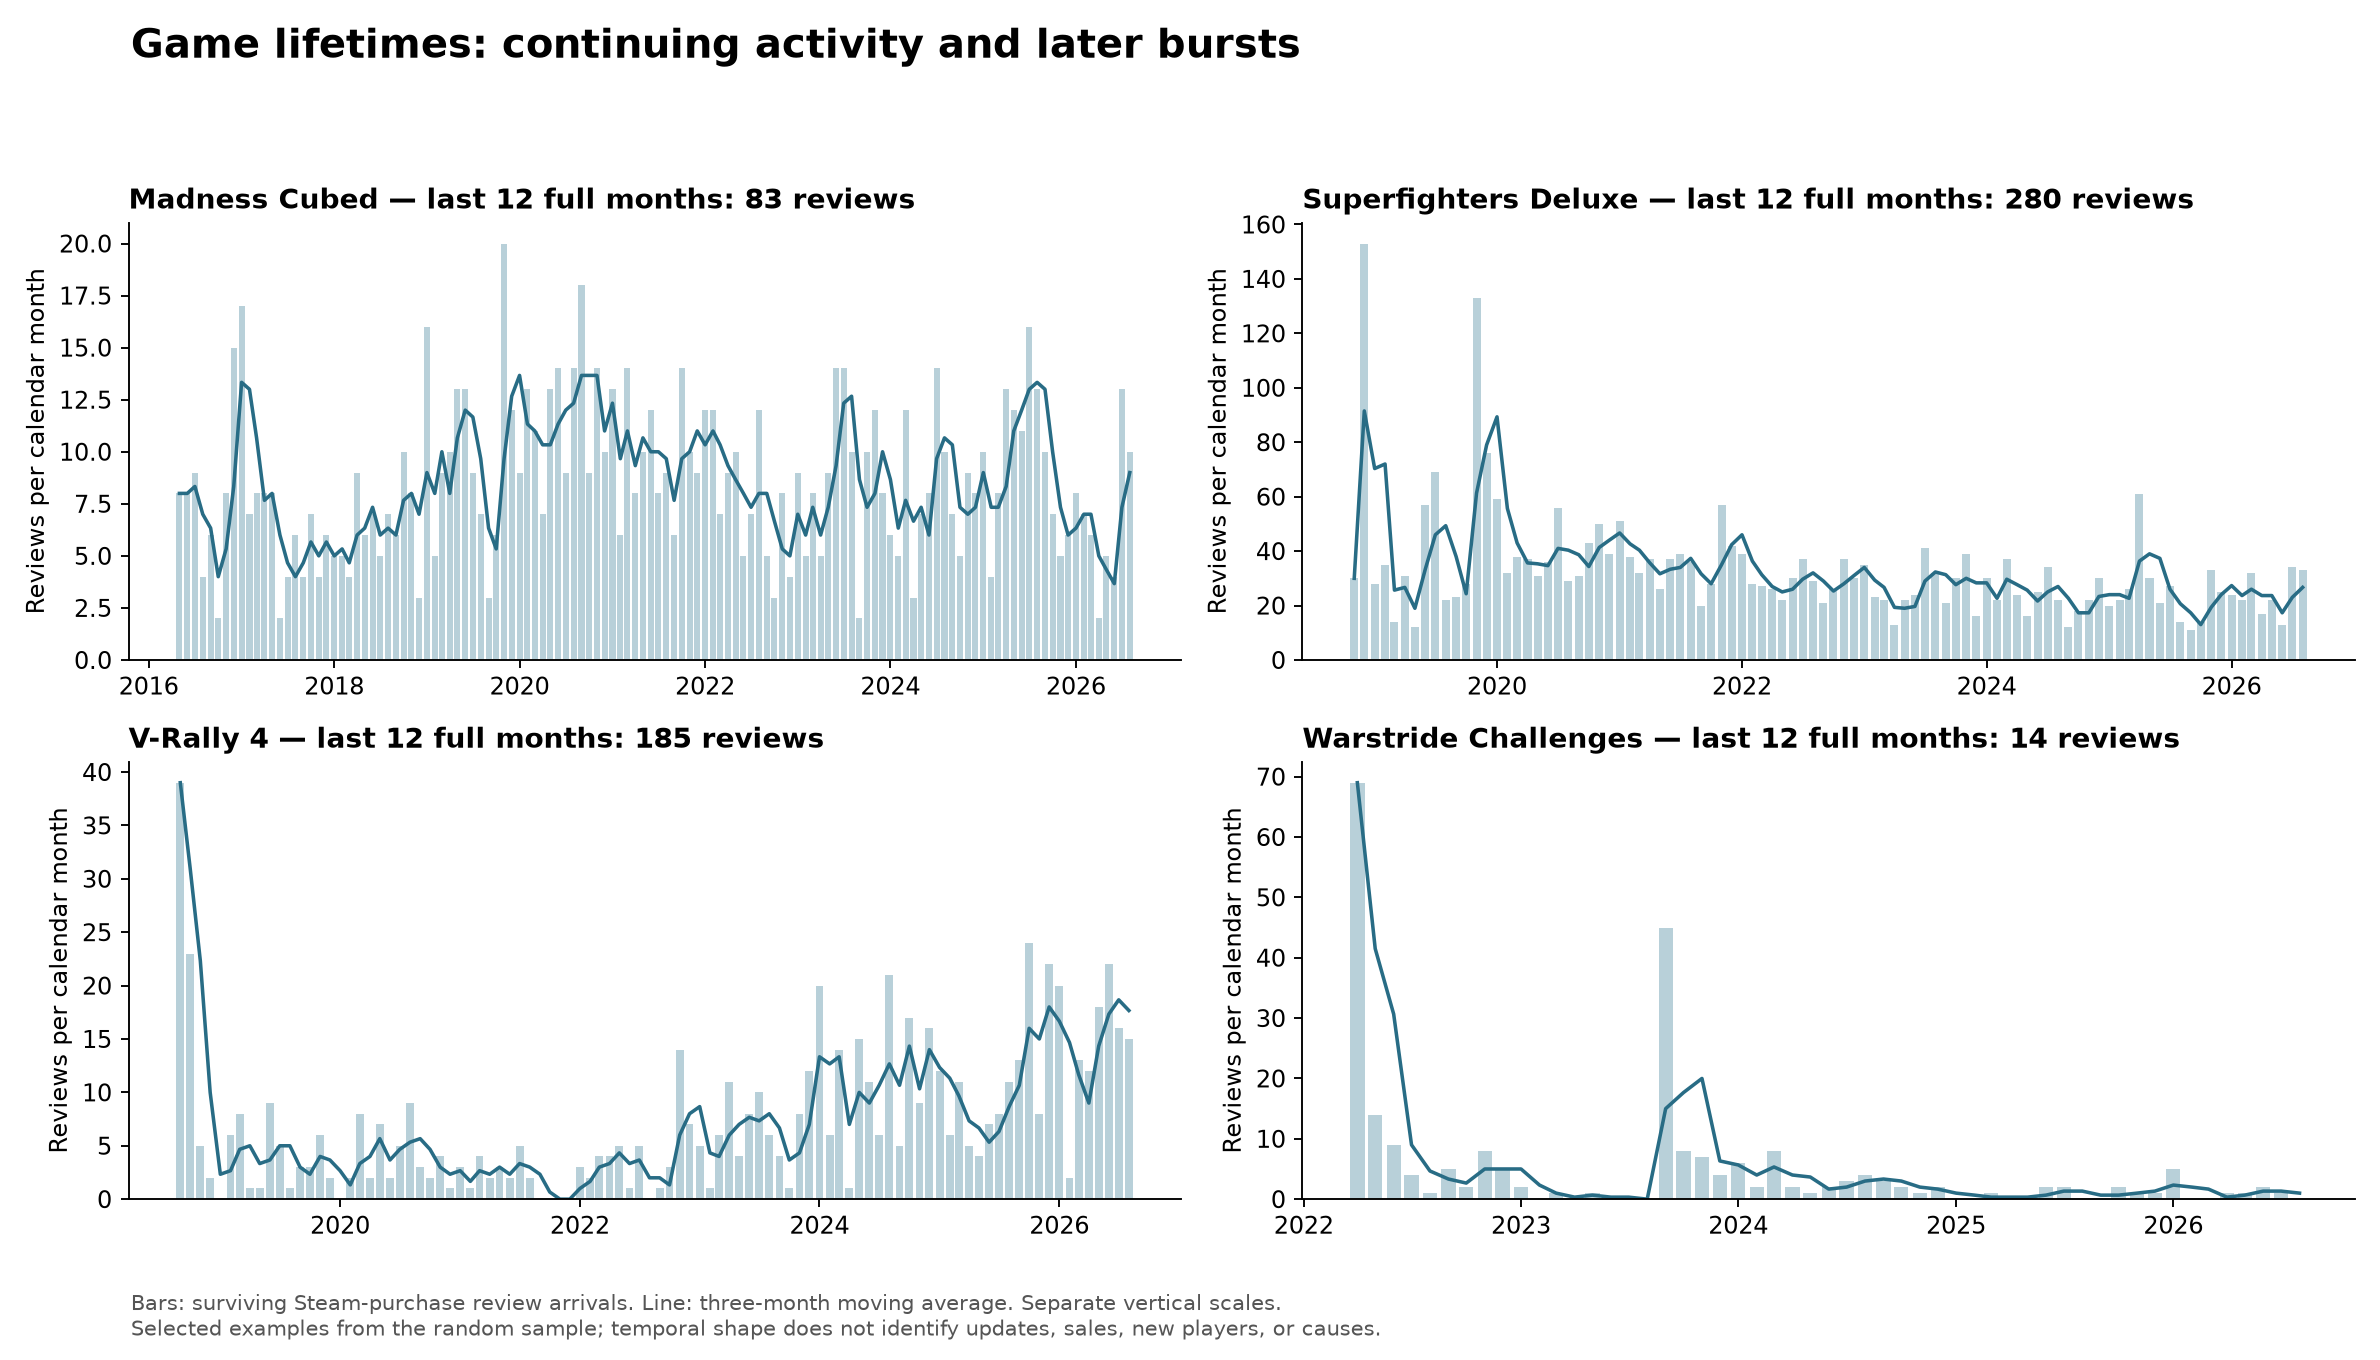
Madness Cubed's monthly stream stays small but persistent across many years.
Superfighters Deluxe has a stronger early period followed by a sustained smaller
stream. V-Rally 4 is an example of later gradual strengthening: the recent year
contains more reviews than its first year, without meeting the sharp-burst
threshold below. It is the only such first-year-versus-recent-year increase
among the 42 comparable valid-date 50-plus games whose windows do not overlap.

Warstride Challenges illustrates a different shape: early concentration, a
distinct later increase, and then a small recent trickle. These cases were
selected from the random sample to illustrate shapes, not to estimate their
prevalence. Whether a game was finished, continually updated, promoted, or
newly discovered during those periods is not established by these records.

## Late bursts are real, but definition-sensitive

The primary screen requires a three-month block starting after year one, at
least twenty reviews, and at least four times the monthly rate of the preceding
six months. It finds seven games among 58 valid dates. Examples include:

| Game | Burst begins | Previous six months | Next three months |
|---|---|---:|---:|
| Yao-Guai Hunter | February 2025 | 104 | 283 |
| Warstride Challenges | July 2023 | 4 | 45 |
| This Means Warp | May 2023 | 35 | 76 |
| 旅者 Travelers | January 2023 | 1 | 53 |
| Vox Machinae | February 2022 | 28 | 75 |
| 沙雕之路 | April 2026 | 13 | 35 |
| Christmas Nightmare | October 2025 | 11 | 32 |

The six-month and three-month durations differ; the comparison is of rates.
These are late increases in the surviving review stream, not diagnoses of
updates, revival from dormancy, virality or new audiences.

Loosening the screen to fifteen reviews and three times the rate finds eleven
games; tightening it to fifty and six times finds four. Thus there is no
threshold-free revival probability hiding in the data. The primary weighted
ever-burst estimate is about 14.4% among 50-plus-review games, with a wide
5.0–23.7% sampling interval, over unequal observed lifetimes. Restricting the
opportunity to a mature first-two-year window leaves only three cases among
42 qualifying 50-plus games. That is too little to support a useful era trend
or a precise personal forecast.

The more reliable result is the distinction between continued accumulation,
gradual strengthening and abrupt late bursts. A game can have years of review
activity without the kind of sharp event that a revival detector is built to
notice. Conversely, one burst need not produce a permanently high review rate.

## Verification and artifacts

The frozen sample, sanitized response pages, complete per-game records, zero-
inclusive monthly series, exact-day windows, clock flags, burst thresholds,
weights and code are retained. Both figures were visually inspected. Mechanical
verification passed 1,272 checks, including cursor chains, empty terminal pages,
record identities, exact-day/month recounts, source-count tolerances, pacing,
caps and closed policies. No reviewer text, account IDs or media were collected.