Steam Market Research 7 archive
Frozen research artifacts, September 7, 2026. Large Parquet datasets, raw API pages and the full announcement inventory remain in the local research directory.
# Independent investigation of Fable Steam Research 1–4

Analysis date: September 6, 2026. Source snapshot: September 5, 2026. This study
reads Fable's published summaries and selected original methods, then tests the
claims against the independently collected data from Codex sessions 5 and 6.
It imports no Fable game records, estimates, visual scores, or review histories.
The old Windows archive was consulted read-only for definitions and code audits.

## Sources

- `../2026-09-05/catalog.sqlite` and `exports/`: 184,664 public game app records,
  128,972 marked released, across 23 checked storefront catalogs. This is not all
  historical Steam apps; delisting and unavailable regions can remove games.
- `../career-history-2026-09-06/reviews.parquet`: the original 24 paid-game subset
  contains 15,445 currently returned Steam-purchase reviews. Three currently free
  games remain outside this study's primary historical comparisons.
- `../../a327ex-site/logs/fable-test-steam-market-research-{1,2,3}.md` and
  `../../a327ex-site/logs/steam-market-research-4.md`: claims, with later corrections
  taking precedence. Selected original scripts/reports are at
  `/mnt/Main/a327ex/steam-market/`, read only.
- Official Steam sale announcements: four individually fetched calendar pages,
  with URLs/excerpts in `official_sale_sources.json`. No fresh game collection.
- Steam's review API and review documentation clarify filtering and mutable
  reviews: https://partner.steamgames.com/doc/store/getreviews and
  https://partner.steamgames.com/doc/store/reviews .

## Definitions

`prepare.py` independently normalizes the original raw game export. It uses a
valid original-Steam date where supplied, otherwise the reported Steam date, and
the previously verified local KOF XV correction. Consequently the main 2023–2025
paid, non-explicit pool is **38,493**, one fewer than the uncorrected session-5
pool. Current free flags and explicit descriptors 3/4 define those exclusions;
no manual seriousness or quality filter is used in the main market pool.

Prices are current USD list prices from a standalone best package, excluding
bundles, multi-game packages, and options requiring another app. Missing price
is not zero. The price/review formula is retained only as a replication device:
`h50 = reviews * current_price * 35.9 >= 50,000`. `h50_n` is the known-price
denominator; review thresholds retain games without an observed price. The
25/35.9/55 constants are sensitivity choices, not confidence limits. No sales,
profit, development cost, or actual revenue is estimated here.

Fixed count outcomes are at least 50, 100, 556, or 1,000 filtered reviews. The
joint benchmark is at least 100 reviews and at least 80% positive. 556 is used to
replicate Fable's career cutoff; it is not treated as proof of 25,000 buyers.

Tag membership is checked at ranks 7, 10, and 20. Current tags do not reconstruct
historical tags. Headline 2023–2025 outcomes use today's cumulative counts, while
2026 and same-calendar-window supply are separate. Neither calendar matching nor
the passage of one year produces equal-age outcomes from this snapshot.

`compare()` directly standardizes against nonmembers in exact observed strata,
usually release quarter/current-price band, with stronger year/price/primary-tag/
description-length or month checks where specified. Require at least five
controls per cell (three for detailed calendar timing). Unsupported target rows
are excluded from both observed and expected totals. Report support explicitly.
Observed/expected ratios are descriptive, with residual composition, creator
clustering, current-state look-ahead, and selection. They are not causal effects,
validated forecasts, or multiplicity-adjusted evidence unless explicitly stated.

Career identity uses normalized literal single developer credits. Names are not
verified people, organizations may change, aliases can split careers, and games
with multiple credits are excluded. A free-inclusive sensitivity has 114,227
games/69,008 names; paid non-explicit sequences have 90,884 games/56,323 names.
Games through July 1, 2026 enter sequences; most release-outcome tests stop July 1,
2025, matching Fable's maturity convention. Current outcome measurements remain
September 5. Some comparisons use one latest or first qualifying release per
name; this changes the target population rather than magically eliminating bias.
Sequences prefer chronology then app ID; known ports, batch arrivals, missing EA
history and delisting can misrepresent first exposure or the true order of work.

All catalog-wide prior-review bands are **current counts of earlier games**, not
counts available at the next launch. Historical reconstruction is limited to the
24 named paid games. Their current surviving reviews omit deleted/filtered
records, and current votes/text are not archived original votes/text. Calendar
launch-month counts in `history_windows.csv` can be zero when reviews first arrive
the next month; Fable's first-nonempty-bucket method would skip that empty bucket.

The rare-pair multiplicity check uses Fable's non-content exclusions, component
minimum 80, pair range 4–40 and max(component rates, baseline) binomial null.
All 10,804 eligible pairs enter BH adjustment, including pairs failing the
outcome-based hit-count screen. This is a diagnostic applied to the new catalog,
not a reanalysis of Fable's exact old search family. Pair tests overlap and the
binomial model treats estimated comparison rates as fixed; the resulting q-values
are not a certification of the surviving combinations.

## Reproduction

From this directory, use `../.venv/bin/python` in this order:

1. `prepare.py`
2. `market.py`, `careers.py`, `history.py`, `selection_check.py`, `timing.py`
3. `followups.py`, `career_extensions.py`, `continuation_checks.py`,
   `additional_checks.py`, `quantity_sensitivity.py`
4. `charts.py`, `validate.py`

Scripts are offline. `official_sale_sources.json` preserves the four calendar
lookups used to encode events; no network is needed to reproduce timing tables.
The raw snapshot and collection policy remain unchanged. No images were
downloaded. The chart is a locally generated statistical plot.

`claim_register.csv` maps the complete finding families to their verdicts and
evidence. `findings.md` records the substantive assessment, also delivered in
chat. Tables retain counts and support; `pair_members.csv`, career Parquet,
historical tables, and the named/audit lists support inspection. The original
quantity regex is preserved as a replication; a stricter largest-count rule
and an outcome-hidden 12-description diagnostic test its interpretation.

Validation discovered non-game tag rows in the all-app source relation. Those
are now filtered during normalization. Every numerical analysis already joined
against the game population, so this removal does not alter its memberships or
results. Validation also checks raw SQLite counts, 250 source records, relation
identities, aggregate bounds, selected exact recounts, 100 developer histories,
historical windows, syntax and closed collection state.
# Independent assessment of Steam Market Research 1–4

Fable found several real, repeatable patterns. The strongest are the relationship
between prior traction and later traction, the weakness of a simple game-count
success story, some specific genre combinations, and the association between
advertised content counts and review response. His descriptive findings are much
better supported than his causal explanations, individual forecasts, and claims
of proven openings. This investigation assesses 52 finding families in
`claim_register.csv`, using independently collected September data.

The source is `/home/adn/a327ex/steam-research/2026-09-05/catalog.sqlite` and its
exports. Session 6 added the continuation, portfolio, historical review and build
destination studies in sibling directories. The catalog contains 184,664 game
apps, 128,972 marked released. The new normalization produces 38,493 valid paid,
non-explicit 2023–2025 games after the independently verified KOF XV date repair.
Historical checks use 15,445 surviving Steam-purchase reviews from 24 selected
paid games. Fable's summaries and selected original scripts were read for claims
and definitions; his game data and outcome estimates were not imported.

## Revenue formulas and prices

Fable's `reviews × 35.9 × current base price` remains an unvalidated revenue
estimator. A calibration on two games by the same maker does not establish its
accuracy for other genres, regions, prices or release eras. The 25–55 range is
not a market-calibrated confidence interval. The 556-review threshold likewise
does not prove 25,000 sales.

The formula mechanically creates a price advantage: reaching its $50,000 line
requires about 466 reviews at $2.99 but only 93 at $14.99. Nevertheless the entire
price association is not arithmetic. Among 2023–2025 games, fixed 100-review
rates are 5.6% at prices up to $5, 12.8% at $5–7, 16.4% at $7–12 and 36.5% at
$12–20. Corresponding 556-review rates are 1.3%, 4.0%, 5.3% and 15.1%. Broad
date/tag/description-length controls do not erase the gradient. This describes
different games at different current prices; it does not show what increasing
the price of the same game would do.

Our data do not independently reproduce the visual scoring or scope regression.
Reviewer playtime is engagement among selected reviewers, not production scope,
and current price may itself follow success. Fable's original art report
correctly says its 355-image sample balanced outcome arms. Consequently its 74%
hit share at art tiers 4–5 is a sample-composition statistic, not the population
probability implied by an unqualified summary of that number.

## Market expansion and concentration

Total recorded released games increased from 10,181 in 2021 to 20,253 in 2025.
Paid non-explicit releases increased from 7,959 to 15,674; their sub-ten-review
share grew from 45.4% to 56.2%. This broadly confirms the supply and low-response
tail observations. But the absolute count with at least 100 reviews also rose,
from 1,530 to 2,277. Growth did not go exclusively into failures.

The median of Fable's formula conditional on at least ten reviews and a known
price is about $13.6K in the 2019 cohort and $11.8K in 2025, with intermediate
cohorts around $10.8–12.2K. His roughly flat conditional scale is recognizable;
it is neither the typical outcome across all releases nor measured income.

The top 5% of released games account for 93.1% of filtered reviews. Concentration
is unmistakable, but translating this into units or revenue is not independently
verified. All these historical comparisons use surviving current catalogs and
unequal review accumulation times.

## Careers: unusually strong replication

With one first 2023–2025 follow-up per developer name, developers whose 2020–2022
catalog includes a 556-review game have a 45.8% chance of that follow-up also
reaching 556, versus 5.0% for developers with earlier releases below that line:
288/629 versus 142/2,840. The association survives removing price from the outcome.
Using Fable's price formula and its known-price denominator gives 63.2% versus
9.2%, close to his later developer-weighted replication.

Among developer names first appearing from 2015 onward, per-release 556-review
rates are 7.7% for game one, 10.0% for game two, 10.1% for game three, 9.4% for
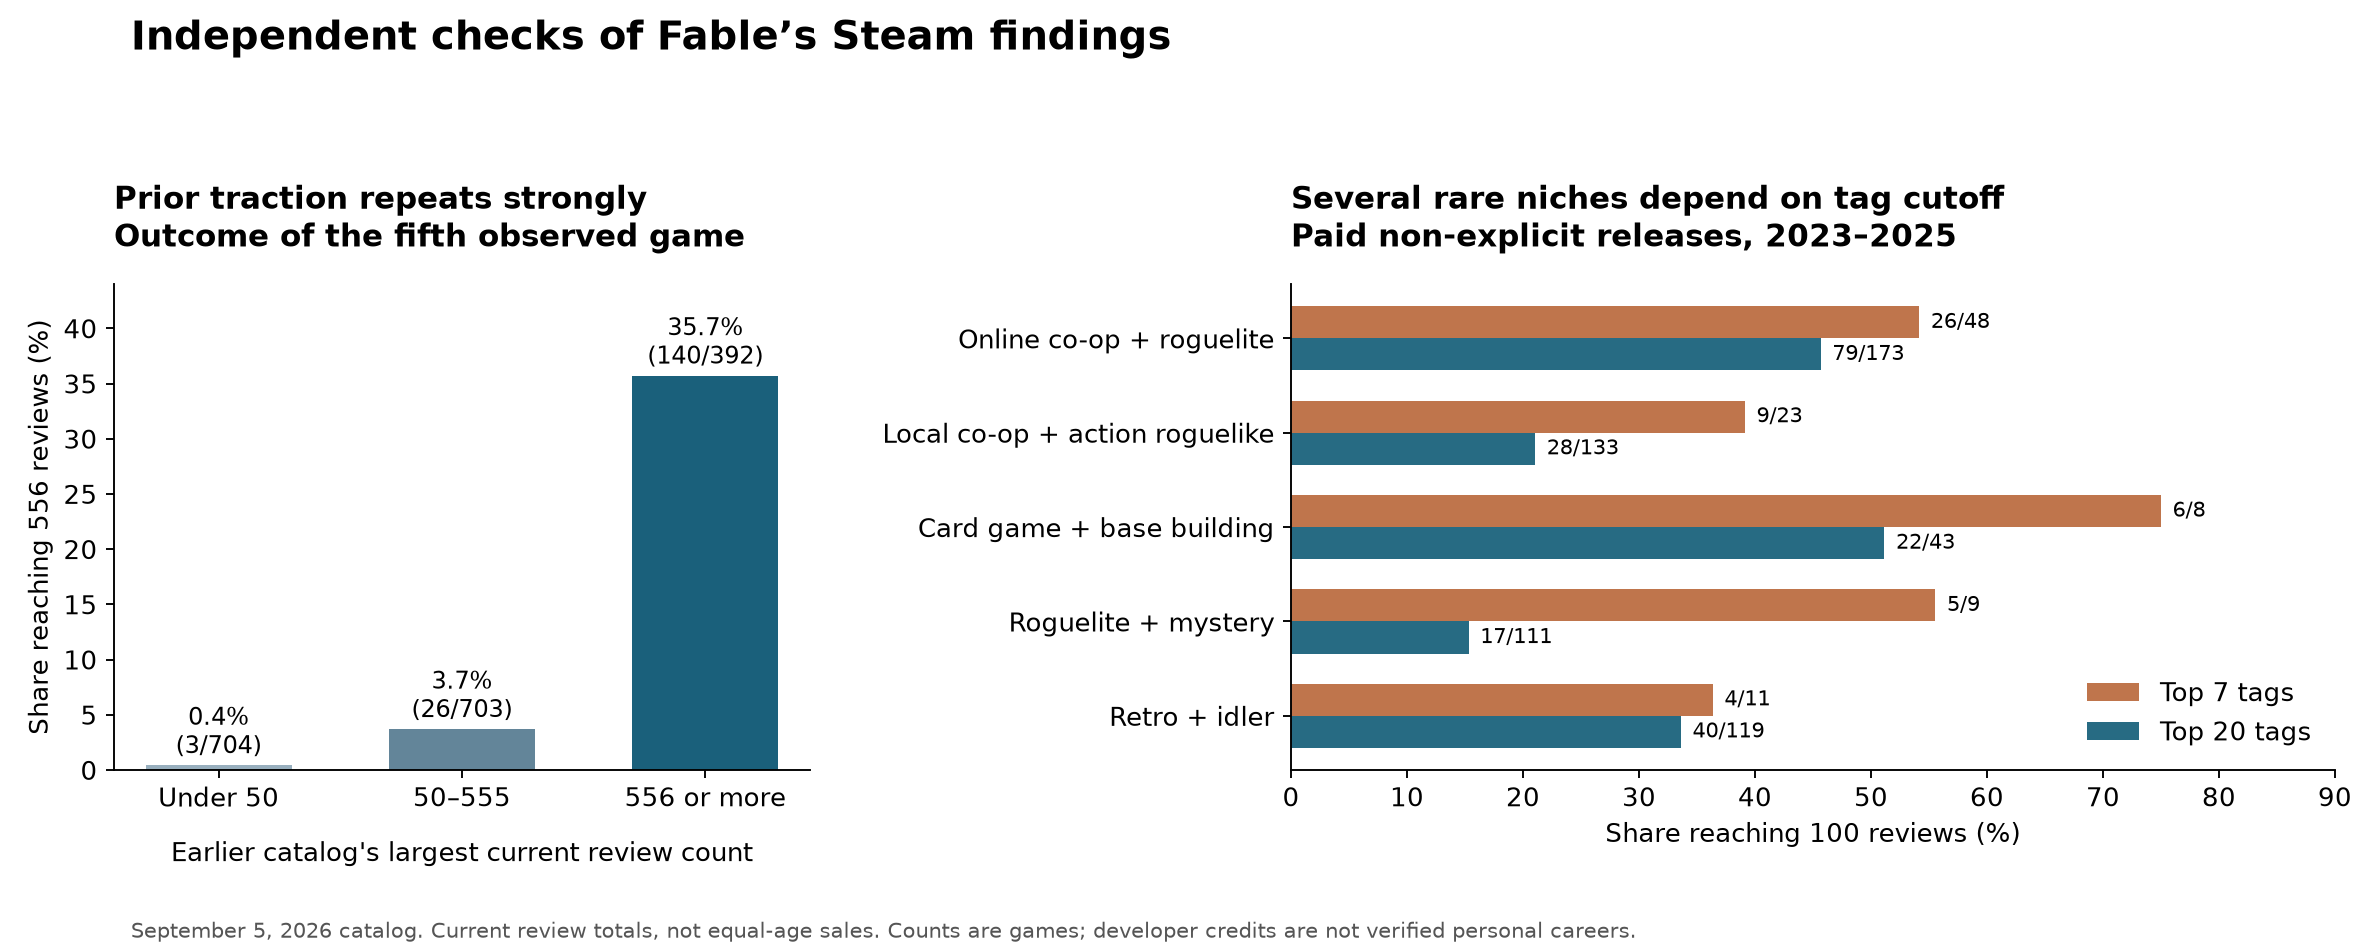
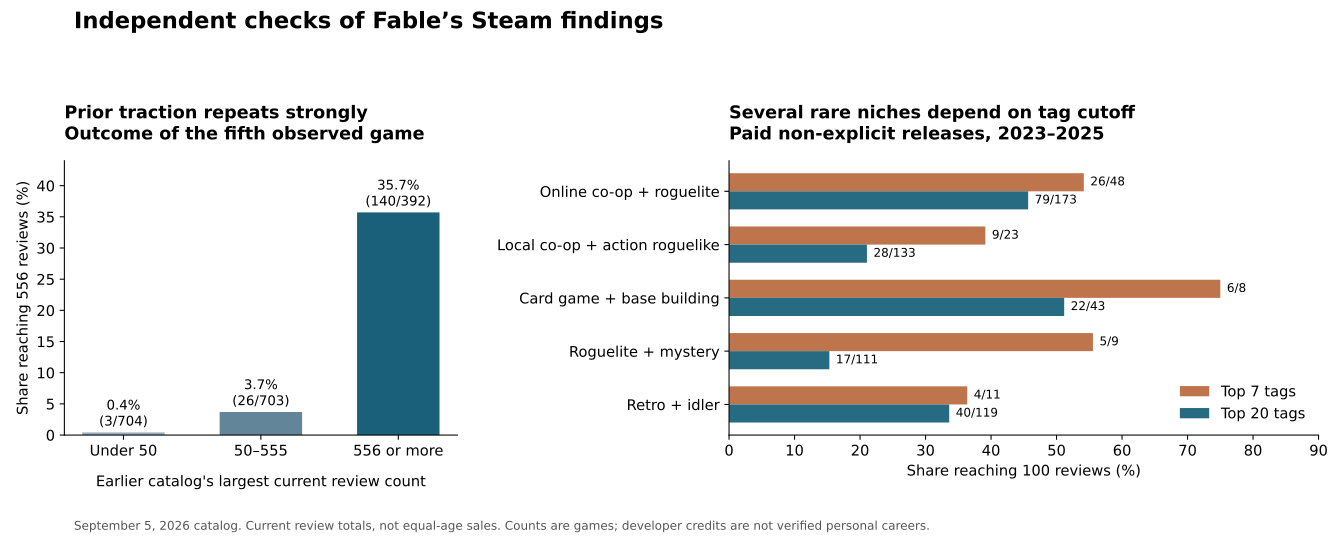
game five and 6.8% for game ten. The fifth-game decomposition is:

| Largest current count of an earlier game | Fifth game reaches 556 |
|---|---:|
| Under 50 | 3/704 = 0.4% |
| 50–555 | 26/703 = 3.7% |
| 556 or more | 140/392 = 35.7% |

The claim that an individual fifth release is a coin toss fails. Fable's
prior-traction decomposition is strongly corroborated. But it cannot establish
that practice contributes nothing: prior traction can itself incorporate
learning, and conditioning on it does not identify the counterfactual effect of
earlier work. A first observed Steam game is not necessarily a maker's first game.

The raw second-observed-game rate is 23.6%. Among first releases at least three,
five, eight and ten years old, ever-observed return rates rise to 33.0%, 36.4%,
43.3% and 52.1%. Thus Fable's censoring correction was right. These are not
retirement rates. One-title developer names still supply 39.3% of 2023–2025
games reaching 556 reviews, and first recorded games supply 47.9%. They are not
irrelevant noise. Simmiland is indeed Sokpop's second recorded Steam release,
currently with 1,796 reviews; the early-traction correction holds.

Multiple moderate outcomes are also informative. Under equal three-year
follow-up after entering a state with at least two releases, names with two or
more 50–555-review games and no larger game later reach 556 in 6.7% of cases,
versus 0.6% for all-low catalogs. Among names releasing again during the window,
the figures are 11.3% versus 1.4%. This closely resembles Fable's promising
climber observation without interpreting it as a guaranteed progression ladder.

Breakouts after moderate predecessors price upward by at least 25% in 58.8% of
cases, versus 33.8% of non-breakouts. Their median next price is $14.99 versus
$5.99 and median release gap 619 versus 260 days. Different primary tags occur
in 82.7% versus 73.9%. The price and gap patterns corroborate Fable; the tag
contrast is smaller, and a release gap does not measure time spent developing.

## Gaps, migration, pivots and cadence

Among paid-game transitions with an earlier 556-review work, later 556-review
rates increase from 29.1% at gaps under six months to 54.1% at gaps of four years
or more. Among one latest transition per name, they are 25.3% and 52.9%. The
four-year group retains about 1.18 times expectation after year/current-price
stratification in that developer-weighted comparison. A simple universal
absence penalty is not visible. This does not prove absence is costless: only
returners are observed, and their projects and unobserved activities differ.

For those stronger-prior names, keeping versus changing the primary tag gives
43.6% versus 42.8% at 556 reviews with one latest transition per name. Some
high-overlap associations remain, but simple genre-staying is not a large
universal advantage. A title-based sequel heuristic gives 58.0% versus 41.7%.
That supports a sequel association while preserving identity and selection
limits. Store tags cannot establish how radically the underlying activity changed.

After only sub-50-review earlier games, changing the primary tag yields 11.3%
versus 6.1% reaching 50 reviews per release. With one latest transition per name,
it becomes 17.8% versus 12.1%. A pivot association survives but is less dramatic
after reducing prolific-maker weighting. Loved misses, restricted to 10–49
reviews, show 16.1% versus 17.0% next-release foothold rates for high versus low
positivity. This descriptive null broadly agrees with Fable.

His cadence table also roughly repeats after conditioning on ever having a
50-review game: career 556-review rates are 41.0% for roughly one release every
one-to-three years, 35.2% at one-to-three releases per year, and 33.0% above three
per year. The claimed halving for the fastest group does not reproduce. The
unrestricted figures are 23.6%, 24.4%, and 22.8%. An outcome-defined seriousness
filter substantially changes the story; neither version establishes an optimal
development cadence or income floor.

First-game positivity barely distinguishes continuation in our fixed three-year
comparison: 26.7% for at least 85% positive versus 26.9% below 70%, requiring ten
reviews. First-game response scale is more informative: 21.3%, 30.3%, and 28.5%
continuation for under 50, 50–555, and 556-plus reviews. Some adjusted differences
remain, with incomplete matching support. Therefore the strong claim that
outcome has no relationship to continuation needs amendment, and nothing here
measures whether persistence is a personality trait.

The broad first-rung ranking repeats: 46.3% of Horror-tagged first games reach
50 reviews, versus 25.5% Action and 17.7% Precision Platformer. Visual Novel and
Simulation also compare favorably. These overlapping current labels do not
define randomized opportunities for inexperienced makers.

## Historical methods and personal forecasts

Fable's monthly `m1` uses the first nonempty calendar bucket. His monthly `m3`
sums the first three nonempty buckets, after dropping zero buckets. Thus a late
launch has a shortened first window, while a sparse game may have its third
nonempty month much later than day 90. Weekly histories use a different clock.

In our independent surviving-review data, SNKRX has 109 reviews in its partial
launch calendar month but **590 by day 30**, and BYTEPATH has 60 versus 71.
Fable's 117 is the SNKRX calendar-bucket histogram count, not a full thirty days;
the additional 117-versus-109 difference is review-channel/population mismatch.
The median launch-calendar fragment in the 24 games is 16.7 days. Lost At Sea has
four reviews by day 90 but six across its first three nonempty months.

Earlier current review totals also differ from what existed before a follow-up:
five of 18 selected paid transitions change Fable's low/mid/556-plus prior-best
band when reconstructed historically. Before Azalea, Horizon's Gate had 231
surviving reviews rather than its current 1,212. Before The Last Wind Monk, The
Inner World had 199 rather than 920. These examples demonstrate look-ahead bias;
they do not imply that Fable never attempted a historical sensitivity. His
audience study did attempt one, but partial monthly buckets and incomplete
coverage remain limitations.

Equal-age arrivals can change a career reading: Horizon's Gate/Kingsvein have
166/165 at day 90; Say No! More/Reignbreaker 235/244; Let Them Come/Onslaught
88/178. Bad Dream: Coma/Afterlife remains a real decline, 91/17. These selected
cases illustrate the importance of age rather than estimating a market-wide rate.

Personal 40–60%, 74%, or 94% forecasts, and plug-in forecasts based on a median
audience-activation ratio, are not calibrated by these data. In particular,
placing a predicted median launch count in a conditional success bucket does
not integrate uncertainty over possible launch counts or future game differences.

## Tags and rare combinations

In the 2023–2025 paid non-explicit catalog with twenty returned tags, fixed
100-review outcomes include:

| Family | Games | Reach 100 | Quarter/price observed-to-expected |
|---|---:|---:|---:|
| Roguelike Deckbuilder | 412 | 152 (36.9%) | 1.76 |
| Online Co-Op + Roguelite | 173 | 79 (45.7%) | 1.92 |
| Auto Battler | 657 | 147 (22.4%) | 1.50 |
| Action Roguelike | 2,966 | 506 (17.1%) | 1.20 |
| Arcade | 6,445 | 578 (9.0%) | 0.63 |
| Precision Platformer | 1,538 | 97 (6.3%) | 0.54 |
| Minimalist | 3,290 | 316 (9.6%) | 0.98 |

The weak arcade/platformer and strong deckbuilder findings are corroborated.
Minimalist looks low in raw counts but essentially ordinary for its date/price
mix under broad membership. Narrow seven-tag membership is weaker; neither
version licenses an intrinsic condemnation of minimalist presentation. The
raw relative roguelike weakening across eras is not mirrored by the same
collapse in date/price-adjusted associations.

Online co-op/roguelite remains favorable against each constituent alone, with
ratios 1.28 and 1.45; removing its three largest titles leaves 76/170 above 100.
Local co-op/action roguelike has only 28/133 above 100, and about 0.83 times
expectation against other action roguelikes. The two co-op findings cannot be
treated as substitutes. Implementation effort is not measured.

Card Game + Base Building reproduces the exact narrow six-of-eight result for
both Fable's formula and 100 reviews. With twenty tags it is 22/43 above 100,
remaining 19/40 after removing the three largest titles, and favorable against
both components. However only nine of 43 also meet 80% positivity. In 2026
January–August, zero narrow seven-tag members becomes 18 twenty-tag members,
two above 100 and neither meeting the joint benchmark. This is an established
older association with weak young-cohort confirmation, not an empty cell.

Roguelite + Mystery changes from five of nine above 100 at seven tags to 17/111
at twenty, approximately ordinary overall and weaker than constituent-only
comparisons. Its purported opening is not robust. Retro + Idler holds up better:
40/119 above 100, 30/119 meeting the joint benchmark, and favorable constituent
comparisons. But 131 newer members make scarcity untenable. Loot + Idler has
35/104 above 100 and a strong adjusted count association, but only 12/104 meet
the joint reception benchmark. Volume and positive reception diverge.

Applying Fable's rare-pair screening family to the new data yields 10,804
eligible comparisons, 347 nominal formula p-values below .05, and three below
.05 after Benjamini–Hochberg adjustment. Card/base-building, retro/idler and
roguelite/mystery do not survive that adjustment. This does not negate the
broader card/base-building evidence; it rejects the interpretation of one small
post-selected p-value as proven whitespace. Overlapping pair tests and estimated
reference rates impose additional limitations.

## Waves, build claims and prose

The supply explosions are real. Seven-tag Idler counts in the first half rise
from 93 in 2023 to 593 in 2026, close to Fable's 91-to-604 observation. Broader
Shop Keeper membership rises from 40 in 2025 H1 to 250 in 2026 H1. Newer lower
current-review rates alone do not establish saturation because cohorts are younger.

The need to look beyond tags is confirmed particularly well: Vampire Survivors
lacks Bullet Heaven even among its twenty returned tags. The named luck-machine
cluster also contains multiple clearly substantial releases: Nubby's Number
Factory 18,062 reviews, CloverPit 24,589, Slots & Daggers 7,361, BALL x PIT
24,571, Scritchy Scratchy 14,898 and RACCOIN 4,202. R.E.P.O., PEAK and RV There
Yet have 338,962, 298,204 and 71,366. These are verified examples, not a sampled
failure denominator or a revenue-based dominance ranking. The format-versus-
experience crystal-ball claim needs historically frozen classification and
out-of-sample triggers, which neither our snapshot nor a hindsight taxonomy supplies.

Numerical content claims recur in 6.5% of games clearing Fable's formula versus
3.2% of sub-ten-review games. Within build-tag games, the figures are 12.8%
versus 7.3%. The pattern survives broad date/price/genre/description-length
checks. However the description audit finds simultaneous soldier counts,
enemy skills and overlapping ability totals among apparent depth claims.

A stricter rule uses the largest single noun count, discards unit counts and
nearby enemy/monster contexts, and avoids summing unlike or duplicated systems.
For 300-plus claims it finds 128 games; 78 have adequate detailed controls, with
1.76 times the expected 100-review count. This supports an association with
advertised options. It does not show that larger nominal counts create more
meaningful configurations or cause higher demand.

Fable's word associations also largely repeat after date, price, primary-tag and
length controls: synergies 1.27, playstyle 1.22, build 1.23, expand 1.36 times
expected 100-review counts; levels .70, score .72, reflexes .54. Experiment is
near expectation at 1.03. These describe products and their current pitches;
changing vocabulary alone is not a demonstrated growth intervention.

## Features, localization, quality and unreplicated historical claims

Controller support, ten or more supported languages, and a demo have 1.73,
2.05 and 1.08 times the expected 100-review counts in the available detailed
strata. Demo presence is much weaker than the other associations, corroborating
Fable's distinction. Achievement support also correlates strongly, but our
dataset does not contain achievement counts and cannot verify a thirty-achievement
rule. Existing features can follow success and reflect project scope/resources.

Among 276 Idler games above 100 reviews, 75% support Chinese and 51.8% Russian,
close to Fable's localization-supply observations. We do not have his genre-wide
language-demand sample independently. Language support does not measure buyer
location or localization return, and small Japanese review shares do not prove
Japanese localization is dead weight. His language sample was selected top games
and only seven languages, not all demand.

Official 2023–2025 seasonal-sale calendars support a strong timing association:
games released during a sale reach 100 reviews at 7.7%, versus 16.6% on ordinary
dates outside the adjacent-week groups. Fine year/month/price/primary-tag
stratification gives about .52 times expectation with 1,783/3,079 supported
sale releases. The pre-sale week is near ordinary expectation under these
controls. September has about .95 times expectation rather than a special
premium; Thursday has a modest 1.15 ratio. Choice of launch date remains selected,
so this is not a randomized estimate of the penalty for moving a particular game.

The claim that quality cannot rescue cold starts is not identified by Fable's
design. Positivity is recommendation among selected buyers/reviewers, not
quality itself; launch momentum can be one path through which quality acts.
Conditioning on momentum cannot rule that path out. Furthermore 143 of our
4,070 reviews created within ninety days were updated later. That does not
prove votes changed, but makes clear why present rollups are not automatically
archived historical sentiment. Steam's documentation says scores above 40%
do not directly affect algorithmic visibility; that narrow statement does not
rule out effects on conversion, recommendations or word of mouth.

We cannot independently verify catalog-wide long tails, update cadence effects,
revival probabilities, Next Fest traffic effects or 1.0 graduation multipliers
from our present data. They require comprehensive dated reviews and treatment
histories. The 24 selected histories are useful for method checks, not substitutes
for those populations. Current EA status in particular selects games still in EA
and cannot distinguish all direct releases from graduates. Lower continuation
among current-EA debuts is measurable but does not identify EA as its cause.

Likewise, art/style probabilities, AI-art complaint prevalence, bugs as the
largest growth lever, and a general praise-versus-complaint maturity ladder are
not independently reproduced. Fable's review corpus deliberately oversampled
helpful and negative English reviews. Those can reveal useful experiences but
cannot be read as buyer-population prevalence or intervention effects. No new
images or catalog-wide review/news collection was launched to manufacture
unwarranted certainty.

The executable scripts, 52-claim register, source membership tables, methodology
and inspected figure accompany this assessment. Mechanical verification passed
1,024 checks before adding the written report/register; those additions do not
change numerical results. Publication was not requested or performed.