Steam Market Research 7 archive
Frozen research artifacts, September 7, 2026. Large Parquet datasets, raw API pages and the full announcement inventory remain in the local research directory.
# Catalog expansion and advertised variety

Offline study of the September 5, 2026 public Steam catalog. Uses paid released
games outside content descriptors 3/4, with current tags and descriptions,
recorded dates and the previously verified KOF XV date correction. Main years
2019–2025; January–August 2025 and 2026 compared separately. 81,619 rows enter
the union of these periods. Neither this metadata filter nor app IDs constitute
manual quality screening or title/edition deduplication.

The question is about breadth and concentration in current storefront
positioning attached to release cohorts. Historical tags, real mechanical
diversity, originality, influence, actual copying, and gameplay quality are not
recovered from these data. Newer named tags can make old activities appear new.

## Measurements

- All top-20 tags; a fixed transparent set of 181 activity/genre tags; and each
  game's highest-ranked tag in that set. Each game contributes one total vote
  spread across its retained tags. The primary-label representation gives it
  exactly one vote, including an unclassified label when necessary.
- Shannon effective diversity is exp(entropy): the number of equally common
  labels giving the same entropy, not a count of true genres. Simpson diversity
  and top-ten shares are saved as additional concentration views.
- Activity pairs use at most the first five ranked activity tags. Counts of
  observed pairs are supplemented by exact hypergeometric expected richness in
  a uniformly drawn 3,000-game sample, including games producing no pairs.
  A second measure counts expected pairs occurring at least five times.
- Coverage sensitivities: exactly twenty returned tags; exactly the first three
  activity labels among games with at least three; at least 100 reviews; and a
  fixed broad ten-tag view. Those use common 1,000-game rarefaction, kept separate
  from the headline 3,000-game comparison.
- Neighbor comparisons sample 3,000 games within each of 2019, 2021, 2023 and
  2025. Tag overlap is Jaccard similarity; the eligible set requires at least
  five non-administrative tags. Lexical overlap uses TF-IDF words and bigrams in
  short pitches, screened for at least fifteen Latin words, English-oriented
  function-word presence and predominantly ASCII text. This text subset does
  not represent every language in Steam. A common current vocabulary/IDF is
  fitted across 2019–2025, not as a historical prediction exercise.
- Nearest neighbors exclude self, then same normalized developer-credit string,
  then both same credit and publisher. Names do not prove different teams.
  Alternate editions can still appear. Two 2,000-game random replicates and a
  3,000-game one-per-credit sample are retained. All comparisons within a
  configuration use equal sample sizes across years.

The selected highest-overlap examples and random neighbor examples are saved.
They include edition variants and formulaic puzzle descriptions. Neither
similar text nor similar tags establishes that two games play identically.
No inference of AI authorship or game lineage is made.

## Reproduction

Use `../.venv/bin/python` from this directory:
`study.py`, `neighbors.py`, `sensitivity.py`, `charts.py`, `validate.py`.
All scripts are offline. Sources remain unchanged. The root network collection
policy remains paused. `findings.md` contains the interpretation, also delivered
in chat; CSV tables and frozen neighbor memberships support inspection.
# Catalog growth versus advertised variety

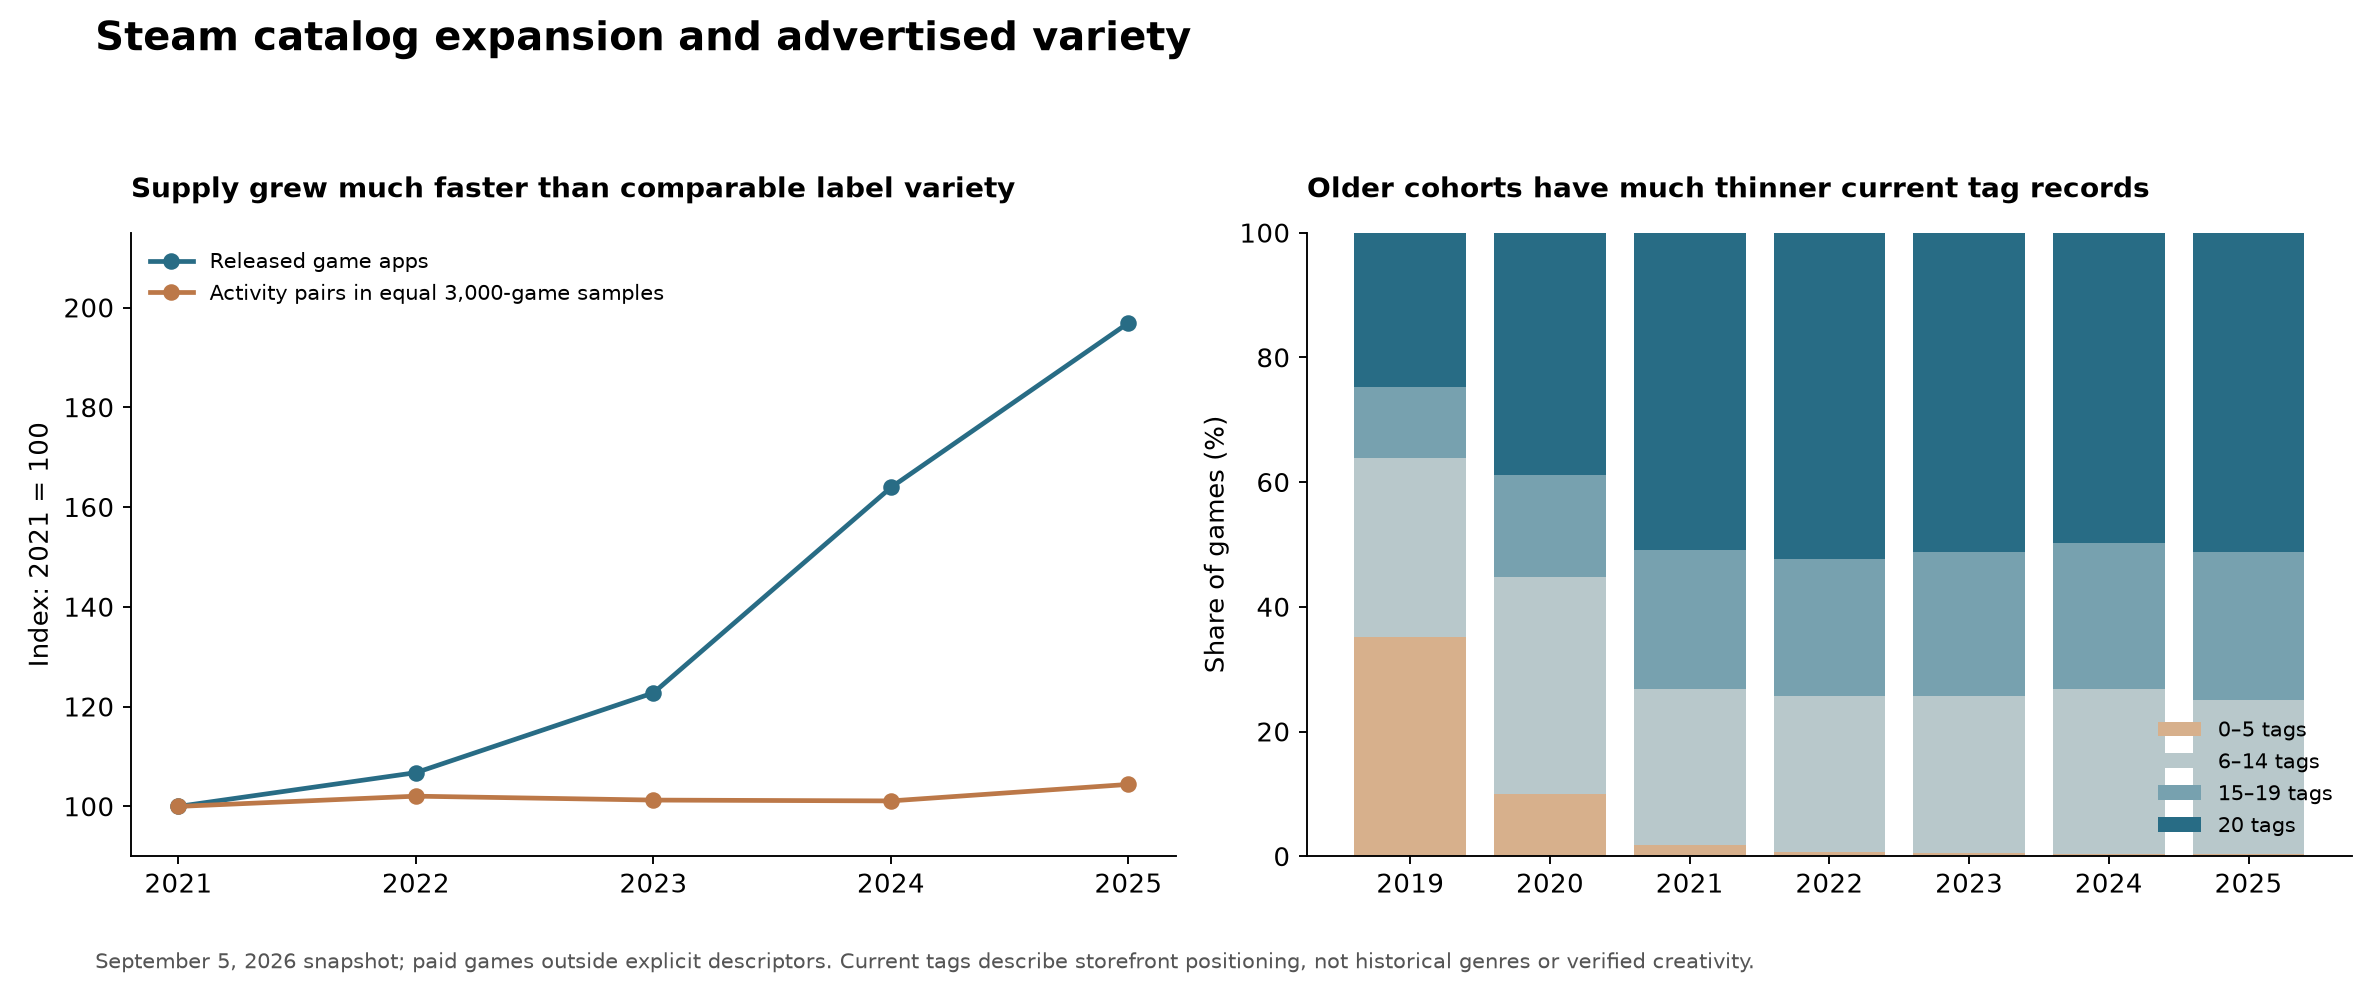
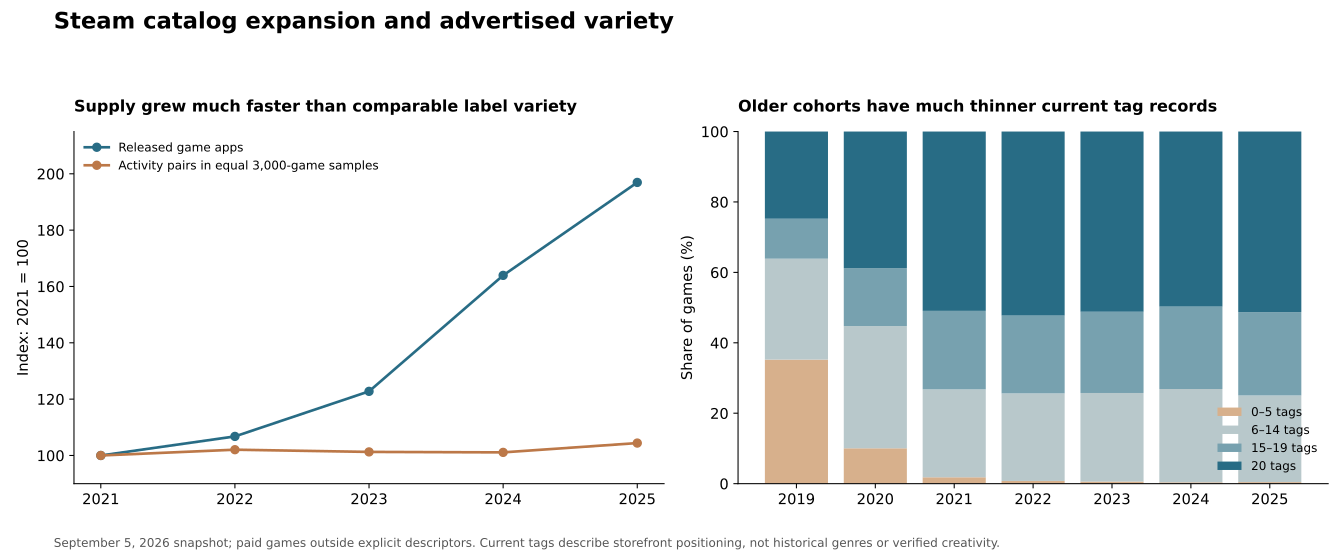
The recent catalog grew much faster than its comparable variety of advertised
activity labels. There is modest broadening and some redistribution, but no
evidence here of either a doubling of creative variety or a general collapse
into indistinguishable storefront pitches.

The analysis uses current September 5, 2026 tags and descriptions attached to
release cohorts. It cannot reconstruct historical genre vocabularies, actual
mechanical differences, influence, originality, or how games play. App IDs can
also distinguish editions of the same work. These are measurements of public
storefront positioning within the documented surviving catalog.

## Scale versus variety

For paid games outside explicit descriptors 3/4:

| Measurement | 2021 | 2025 | Change |
|---|---:|---:|---:|
| Released game apps | 7,959 | 15,674 | +96.9% |
| Distinct pairs among first five activity tags | 5,549 | 7,074 | +27.5% |
| Expected distinct pairs in equal 3,000-game samples | 3,812 | 3,980 | +4.4% |
| Expected pairs represented at least five times in those samples | 999 | 1,068 | +6.9% |
| Share assigned to the ten most common primary activity labels | 59.7% | 56.8% | -2.9 percentage points |

A larger cohort mechanically contains more rare combinations. The equal-size
comparison removes that part of the increase. The result is not zero change:
labels are somewhat less concentrated, and repeated combinations become a little
more varied. But the increase is much smaller than the near-doubling of supply.

Shannon effective diversity across the fixed activity-tag set rises from 72.6
to 79.0, and across primary activity labels from 40.4 to 45.5. These are
concentration measures expressed as equivalent equally common labels, not counts
of real genres. The broader all-tag effective diversity is nearly unchanged,
156.5 to 158.0.

The same-calendar comparison for January–August shows 9,922 eligible releases in
2025 versus 14,125 in 2026 (+42.4%), while expected pair richness in 3,000 games
rises from 3,946 to 4,094 (+3.7%). Again, the main movement is scale, with a smaller
increase in comparable advertised breadth.

## The 2019 measurement problem

In the 2019 cohort, the median game has nine returned tags and 35.2% have at most
five. In 2021 the median is twenty and only 1.8% have at most five; in 2025 those
figures are twenty and 0.4%. Treating those records as equally rich descriptions
would badly exaggerate the apparent increase in variety.

Restricting to games with exactly twenty returned tags reduces the apparent
2019–2025 shift substantially. Expected activity pairs in a common 1,000-game
sample rise from 2,270 to 2,641 (+16.3%), compared with 1,397 to 2,379 (+70.3%)
without the coverage restriction. The exact-twenty subset is selected, not a
perfect correction; it demonstrates sensitivity to metadata completeness.

The 2021–2025 direction survives the other checks, at modest magnitudes. With
exactly twenty tags, equal-size pair richness rises about 2.6%. Keeping exactly
three activity tags per qualifying game yields about 4.5%. Restricting to games
with at least 100 reviews yields about 10.2%. Coverage conditions change the
population, so these are robustness views rather than interchangeable estimates.

Valve's official June 2020 announcement introduced a Steamworks Tag Wizard beta.
That is consistent with the timing of a change in tagging practice, but the
snapshot alone cannot attribute the full observed discontinuity to that tool.
The main quantitative reading therefore emphasizes the more comparable recent
cohorts instead of claiming a sudden creative expansion around 2020.

## Growth inside familiar labels

Using each game's highest-ranked tag in the fixed activity set, the largest
absolute additions from 2021 to 2025 are Adventure (+897), Action (+835), Strategy
(+709), Horror (+521), RPG (+388), and Action Roguelike (+321). These six account
for about 47.6% of net growth. Most are already broad, familiar categories.

Shares nevertheless move: Horror rises from 2.5% to 4.6%, Action Roguelike from
1.1% to 2.6%, Idler from 0.2% to 1.3%, and Incremental from 0.5% to 1.3%.
Generic Action falls from 16.4% to 13.6%, and Puzzle from 7.0% to 4.3%.
These are primary-label shares, not all games possessing each feature. A more
specific label gaining rank can displace a broader one without the game itself
changing category in a deeper sense.

2,490 pairs in the 2025 cohort are absent from the 2021 cohort under the same
first-five activity-tag definition. However, only 268 appear in five or more
2025 games and just eleven in twenty or more. Together they account for 4.5% of
2025 pair occurrences. The repeated additions include Desktop Companion + Idler,
Management + Shop Keeper, Job Simulator + Management and Idler + Loot.

Pairs involving Bullet Heaven illustrate the limit: the label can be absent
from an older cohort even where a relevant activity existed. These are additional
observed label combinations relative to 2021, not identified inventions or
historical family trees.

## Do neighboring pitches become more alike?

Equal-size 3,000-game samples compare each game's closest other game. For tags,
the metric is Jaccard overlap; for short descriptions it is lexical TF-IDF
cosine similarity in an explicitly English-oriented subset. Outcomes/review
counts do not enter the similarity calculation.

With different developer-credit strings, median nearest tag similarity is
0.421 in 2021 and 0.429 in 2025. Median nearest short-pitch similarity is 0.156
and 0.153. Removing shared publishers gives 0.417/0.429 for tags and 0.155/0.153
for pitches. Smaller random replicates and one-per-credit samples preserve the
broadly flat recent pattern. All configurations compare equal numbers of games.

The example audit includes exactly repeated puzzle descriptions and regional
editions of Wolfenstein: Youngblood. Such cases demonstrate that repetition
exists, but many high-similarity neighbors share a publisher or are variants.
They do not justify calling a large share of the market clones. Conversely,
different wording does not establish different gameplay.

The supported reading is that many more games occupy familiar advertised
territory, while the breadth and distribution of that territory change more
slowly. That does not make those additional games valueless; execution,
presentation, specific rules and audiences are not resolved by these measures.

## Reproduction and checks

The fixed 181-label activity set, all-tag alternatives, coverage tables, exact
rarefaction results, neighbor samples, example pairs and scripts are retained.
The figure was generated locally; no store images were downloaded. Mechanical
verification passed 48 checks for identities, count/entropy recounts,
rarefaction bounds, equal comparison-pool sizes and score bounds. The original
snapshot and paused bulk-network policy are unchanged.